IBM WebSphere - Tivoli Performance Viewer application response time

by
Jeremy Canfield |
Updated: March 08 2020
| IBM WebSphere articles
- In the WebSphere admin console, expand Monitoring and Tuning > Performance Viewer, and select Current activity.
- Select the server that contains the application that you want to monitor.
In this example, the Snoop Servlet of the Default Application was refreshed twice to generate some monitoring data.
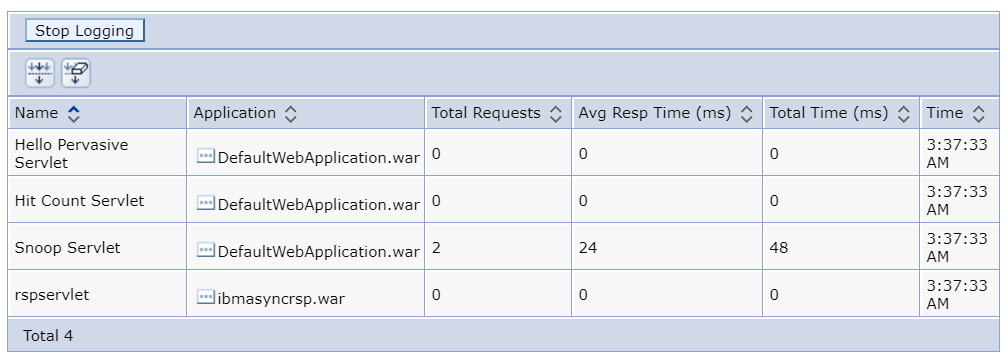
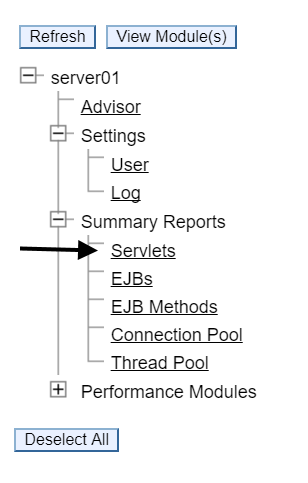
By default, the Servlets Summary Report is displayed. There are a number of other type of reports that can be displayed.
Did you find this article helpful?
If so, consider buying me a coffee over at 