IBM WebSphere - Getting Started with Tivoli Performance Viewer

by
Jeremy Canfield |
Updated: April 28 2020
| IBM WebSphere articles
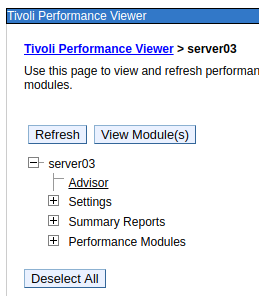
In the WebSphere admin console, expand Monitoring and Tuning > Performance Viewer > Current activity. Select a node, server, or cluster. This will display the Tivoli Performance Viewer.
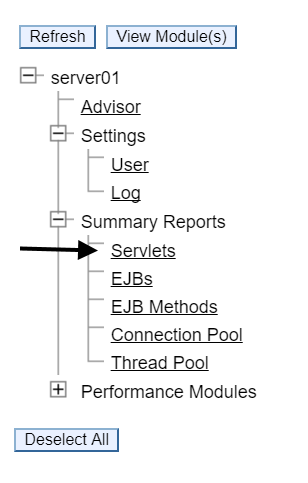
There is no need to select the Start Logging button to watch the collection of performance metrics in real time. The Start Logging button writes the events to a log file so that you can "replay" the monitoring later. For more on Start Logging, check out this article. By default, the Servlets Summary Report is displayed. By default, the Servlets Summary Report is displayed.
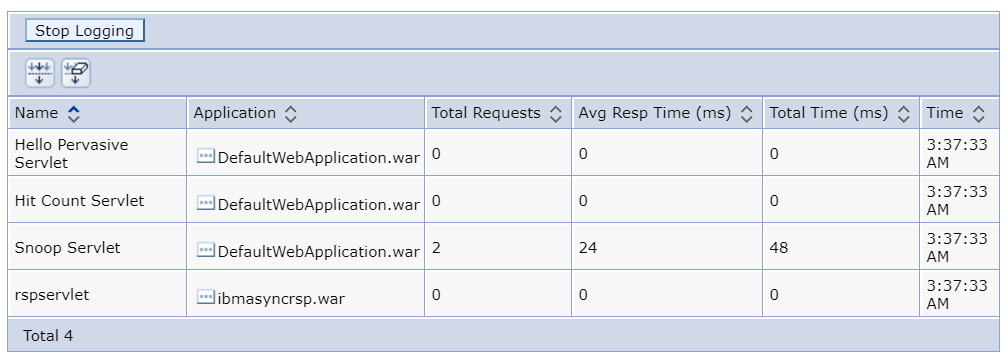
In this example, the Snoop Servlet was refreshed twice to generate some data.
Did you find this article helpful?
If so, consider buying me a coffee over at 