
If you are not familiar with a memory leak, check out understanding memory leak in Java.
- In the Introscope investigator, select the Metric Browser tab.
- Expand SuperDomain > server_hostname > server_type > your_jvm > GC Heap.
By default, Introscope will display data for the last 8 minutes, and update about once every 30 seconds. Typically, you will toggle off Live monitoring, and then select a time range, such as 15 minutes, 1 hour, or 1 day.
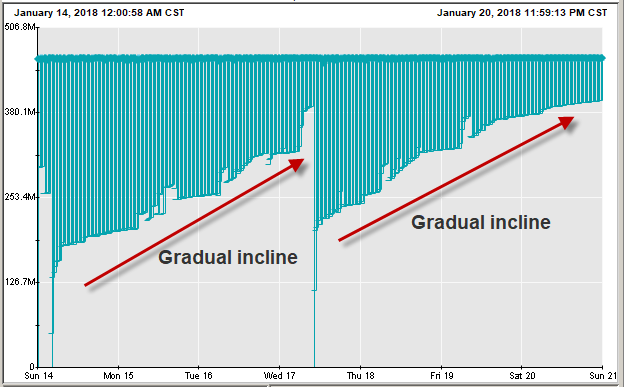
In this example, there is clearly a memory leak. The minimum bytes in use gradually increases. A steady incline is a visual representation of a garbage collector inability to remove some of the objects from the heap. Given enough time, a memory leak will cause all of the heap space to be used, causing an out of memory situation. A memory leak means there is some issue with the code of an application, and a code change will be needed to resolve the memory leak. For example, one possibility is that the code is constantly putting very large PDF files into the heap.
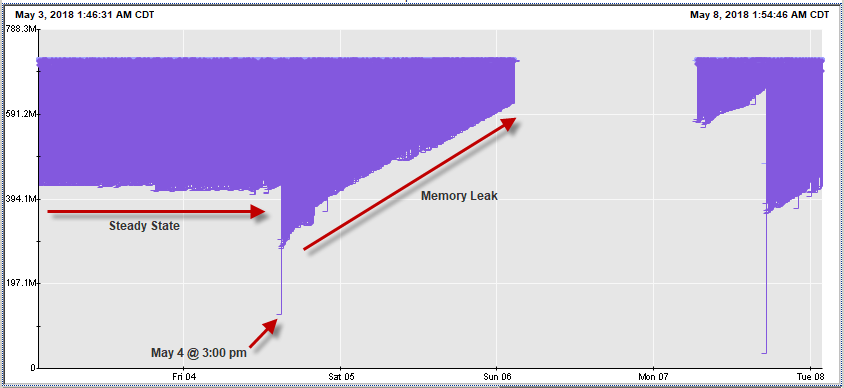
When the minimum heap space reaches the total available heap space, the JVM will run out of heap space, and an out of memory java heap space event should appear in the JVM logs.
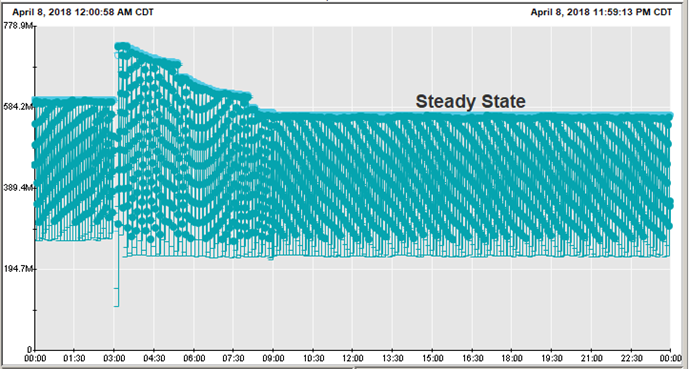
On the other hand, this example shows good heap utilization. After the JVM was restarted, there was some activity and eventually the heap reached a steady state.
Correlate the memory leak to an app
If there is a memory leak, and a single app running in the JVM, you know what app has the code that is producing the memory leak. On the other hand, if there are numerous apps running in the JVM, you will want to determine what app is associated with the memory leak. To determine this, if you have a heap visualizer tool, use the visualizer tool to determine when the memory leak started. Then, find the app the was deployed to the JVM just before the memory leak started, which can be done by checking the JVM logs (eg. SystemOut.log for WebSphere, catalina.out log for Tomcat). In this example, the app that was deployed to the JVM on May 4 near 3:00 pm would be the app associated with the memory leak.
Tomcat
Tomcat's catalina.log does a good job at identifying threads that may produce a memory leak.
SEVERE: The web application [/myApp] appears to have started a thread named [myThread] but has failed to stop it. This is very likely to create a memory leak.
What you want to do is to determine if these events in catalina.log are indeed producing a memory leak, because sometimes these events can be false positives. To determine this, it usually makes sense to first check historical catalina.log when the JVM was restarted or when the WAR was deployed to the JVM to see if these events always occur when the JVM is restarted or when the WAR is deployed. If these events are consistent, then what you want to do is to see if the pattern in Introscope is consistently suggestive of a memory leak. If so, this is fairly strong evidence that the thread created by the app is indeed producing a memory leak.
Did you find this article helpful?
If so, consider buying me a coffee over at 