IBM WebSphere - Getting Started with the Performance and Diagnostic Advisor

by
Jeremy Canfield |
Updated: March 08 2020
| IBM WebSphere articles
The Performance and Diagnostic Advisor is a tool that is used to append events to SystemOut.log. For example, if a memory leak is detected, a memory leak event will be appended to SystemOut.log.
- In the WebSphere admin console, navigate to Servers > Server Types > WebSphere application servers.
- Select your application server.
- Select Performance and Diagnostic Advisor Configuration.
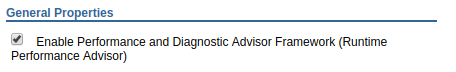
By default, the Performance and Diagnostic Advisor is not enabled. Checkmark Enable Performance and Diagnostic Advisor to enable the performance advisor.
Probably the most used feature of the Performance and Diagnostic Advisor tool is to be able to spot a memory leak.
Did you find this article helpful?
If so, consider buying me a coffee over at 