Introscope - Determine what caused a JVM to heap dump

by
Jeremy Canfield |
Updated: March 09 2020
| Introscope articles
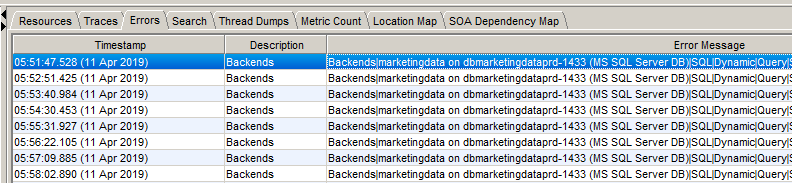
Let's say an application server, such as Tomcat or WebSphere, had a heap dump. In the Introscope investigator, select the Metric Browser tab, and expand SuperDomain > server_hostname > server_type > your application sever and select the Errors tab. Select time range > Custom Range, and set the start time to be about 1 hour before the application server heap dump and the end time about 15 minutes after the heap dump. In this example, there are a number of errors with SQL Server. Now we have a clue into what caused the heap dump - some issue between the application server and the SQL Server database.
Did you find this article helpful?
If so, consider buying me a coffee over at 