
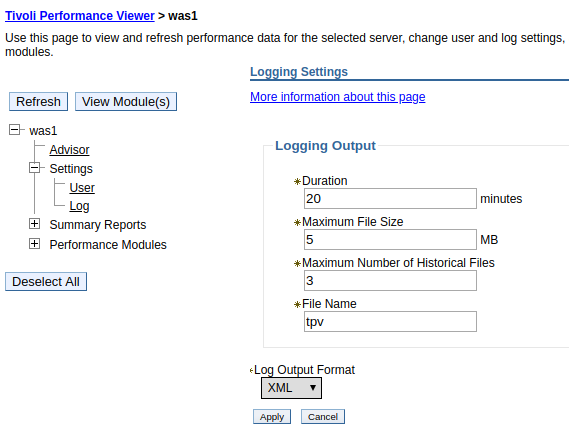
In the WebSphere admin console, select Monitoring and Tuning > Performance Viewer > Current Activity > your server > Settings > Log. This will display options to configure how the Tivoli Performance Viewer logs events to log file. Notice in this example file name is tpv.
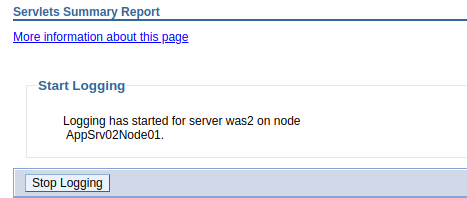
When selecting the Start Logging button in the Tivoli Performance Viewer, events will be written to ${was_install_root}/profile/your_profile/logs/tpv/ directory on the server that the application server or node resides. While logging is occurring, the log file on the server will be "tpv_{hostname}_{integer}_1.txt". When Stop Logging is selected, the file will be zipped.
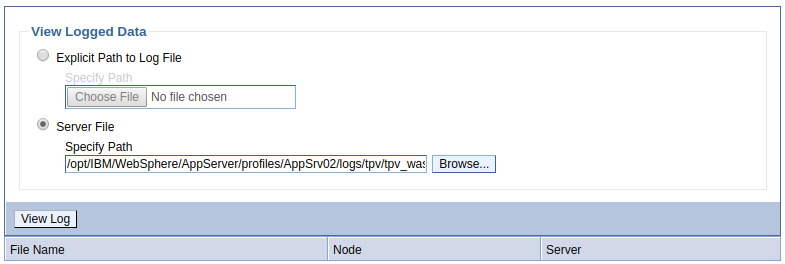
The logs can then be used to view reports of a monitoring session. At Monitoring and Tuning > Performance Viewer > View Logs, you can select a tpv log that was created.
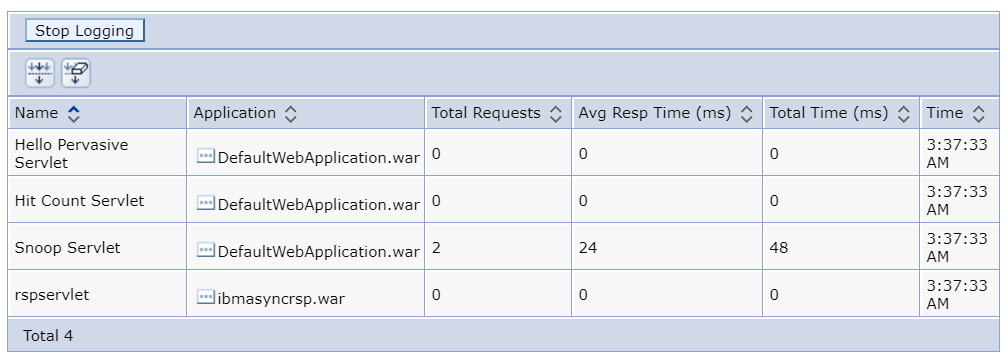
Once the log file has been loaded, you will be able to view reports of the monitoring session that was logged.
Did you find this article helpful?
If so, consider buying me a coffee over at 