IBM WebSphere - Tivoli Performance Viewer heap

by
Jeremy Canfield |
Updated: March 08 2020
| IBM WebSphere articles
Follow these steps to monitor an application servers heap utilization using the Tivoli Performance Monitor in the WebSphere admin console.
- In the WebSphere admin console, select Monitoring and Tuning > Performance Viewer > current activity.
- Select your application server.
- Expand Performance Modules and checkmark JVM Runtime.
- Select View Modules.
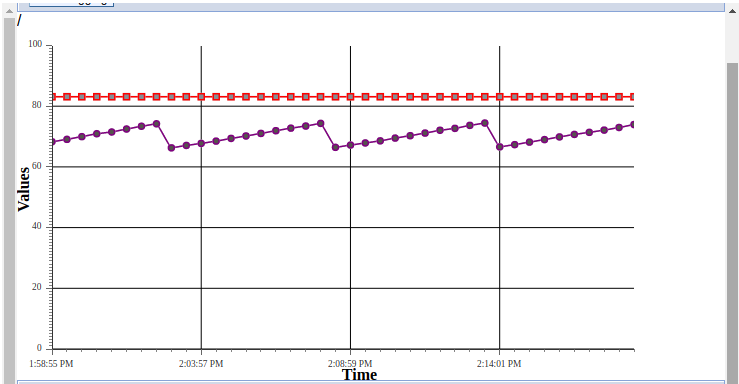
A graph will be displayed that contains the max heap of the application server (red line) and the used heap (blue line).
Did you find this article helpful?
If so, consider buying me a coffee over at 