
If you use the aws cloudwatch describe-alarms command shortly after creating the cloudwatch alarm, the state may be INSUFFICIENT_DATA and the reason may be "Unchecked: Initial alarm creation". This may be normal and not suggestive of some problem. It may simply just take some time, perhaps 5 or 10 or 15 minutes for the new Cloudwatch alarm to establish communication with the service associated with the Cloudwatch alarm.
~]# aws cloudwatch describe-alarms
{
    "MetricAlarms": [
        {
            "AlarmName": "high-cpu",
            "AlarmArn": "arn:aws:cloudwatch:us-east-1:123456789012:alarm:high-cpu",
            "AlarmDescription": "CPU Utilization exceeds 10% in the last 5 minutes",
            "AlarmConfigurationUpdatedTimestamp": "2023-06-21T01:53:16.629000+00:00",
            "ActionsEnabled": true,
            "OKActions": [],
            "AlarmActions": [
                "arn:aws:sns:us-east-1:111122223333:my-topic"
            ],
            "InsufficientDataActions": [
                "arn:aws:sns:us-east-1:111122223333:my-topic"
            ],
            "StateValue": "INSUFFICIENT_DATA",
            "StateReason": "Unchecked: Initial alarm creation",
            "StateUpdatedTimestamp": "2023-06-21T01:54:00.144000+00:00",
            "MetricName": "CPUUtilization",
            "Namespace": "AWS/EC2",
            "Statistic": "Average",
            "Dimensions": [
                {
                    "Name": "InstanceId",
                    "Value": "i-01234475cf14abcde"
                }
            ],
            "Period": 300,
            "Unit": "Percent",
            "EvaluationPeriods": 1,
            "Threshold": 50.0,
            "ComparisonOperator": "GreaterThanThreshold"
        }
    ],
    "CompositeAlarms": []
}
View the History
It may simply be the case that the current state of the Cloudwatch alarm is INSUFFICIENT_DATA, but there may have been historical occurrences of the Cloudwatch alarm being in some other state, such as OK. The aws cloudwatch describe-alarm-history command can be used to view the history of the Cloudwatch alarm. What you are basically looking for here is a StateUpdate event showing the state was updated from INSUFFICIENT_DATA to ALARM. In this example, at 10:29 am the state was updated from INSUFFICIENT_DATA to ALARM and then ten minutes later, at 10:39 am, the state was updated from ALARM to INSUFFICIENT_DATA.
~]$ aws cloudwatch describe-alarm-history --alarm-name "my-cloudwatch-alarm"
{
    "AlarmHistoryItems": [
        {
            "AlarmName": "my-cloudwatch-alarm",
            "AlarmType": "MetricAlarm",
            "Timestamp": "2025-11-06T10:39:26.248000+00:00",
            "HistoryItemType": "StateUpdate",
            "HistorySummary": "Alarm updated from ALARM to INSUFFICIENT_DATA"
        },
        {
            "AlarmName": "my-cloudwatch-alarm",
            "AlarmType": "MetricAlarm",
            "Timestamp": "2025-11-06T11:29:29.247000+00:00",
            "HistoryItemType": "Action",
            "HistorySummary": "Successfully executed action arn:aws:sns:us-east-1:123456789012:my-topic"
        },
        {
            "AlarmName": "my-cloudwatch-alarm",
            "AlarmType": "MetricAlarm",
            "Timestamp": "2025-11-06T10:29:26.248000+00:00",
            "HistoryItemType": "StateUpdate",
            "HistorySummary": "Alarm updated from INSUFFICIENT_DATA to ALARM"
        }
]
Check for Metrics
It may simple be the case that the AWS service associated with the Cloudwatch alarm is not entering into whatever state is required for the Cloudwatch alarm to go into an In Error state. The aws cloudwatch get-metric-data command can be used to see if there have been any occurrences of the AWS service associated with the Cloudwatch alarm entering into whatever state is required for the Cloudwatch alarm to go into an In Error state. In this example, there are 5 occurrences of my-lambda-function going into an Error state.
~]$ aws cloudwatch get-metric-data --metric-data-queries '[{"Id":"m1","MetricStat":{"Metric":{"Namespace":"AWS/Lambda","MetricName": "Errors","Dimensions":[{"Name": "FunctionName", "Value":"my-lambda-function"}]},"Period": 60, "Stat":"Sum"},"ReturnData":true}]' --start-time "2025-11-18T00:00:00Z" --end-time "2025-11-18T14:00:00Z"
{
    "MetricDataResults": [
        {
            "Id": "m1",
            "Label": "Errors",
            "Timestamps": [
                "2025-11-18T13:49:00+00:00",
                "2025-11-18T13:48:00+00:00",
                "2025-11-18T13:37:00+00:00",
                "2025-11-18T13:23:00+00:00",
                "2025-11-18T12:05:00+00:00"
            ],
            "Values": [
                2.0,
                1.0,
                1.0,
                1.0,
                1.0
            ],
            "StatusCode": "Complete"
        }
    ],
    "Messages": []
}
Misconfigured Cloudwatch Alarm
INSUFFICIENT_DATA may be returned if you have a misconfigured Cloudwatch alarm, such as an incorrect namespace or incorrect metricname. For example, for a billing alarm, the namespace must be AWS/Billing and the MetricName is almost always EstimatedCharges. Notice in this example that the MetricName is EstimatedCharge (missing the s).
~]$ aws cloudwatch describe-alarms --query 'MetricAlarms[?AlarmName==`billing`]'
[
    {
        "EvaluationPeriods": 1,
        "TreatMissingData": "missing",
        "AlarmArn": "arn:aws:cloudwatch:us-east-1:123456789012:alarm:billing",
        "StateUpdatedTimestamp": "2024-02-06T02:03:25.850Z",
        "AlarmConfigurationUpdatedTimestamp": "2024-02-06T02:14:04.186Z",
        "ComparisonOperator": "GreaterThanThreshold",
        "AlarmActions": [
            "arn:aws:sns:us-east-1:123456789012:my-topic"
        ],
        "Namespace": "AWS/Billing",
        "Period": 21600,
        "StateValue": "INSUFFICIENT_DATA",
        "Threshold": 70.0,
        "AlarmName": "billing",
        "Dimensions": [
            {
                "Name": "Currency",
                "Value": "USD"
            }
        ],
        "DatapointsToAlarm": 1,
        "Statistic": "Maximum",
        "StateReason": "Unchecked: Initial alarm creation",
        "InsufficientDataActions": [
            "arn:aws:sns:us-east-1:123456789012:my-topic"
        ],
        "OKActions": [],
        "ActionsEnabled": true,
        "MetricName": "EstimatedCharge"
    }
]
CPUUtilization for EC2
Let's say you create a cloudwatch alarm using the aws cloudwatch put-metric-alarm command, perhaps something like this. By default, the minimum period for CPUUtilization for EC2 is 300 seconds (5 minutes) thus --period will need to be 300 or greater. If you set the --period to something less than 300, this can cause INSUFFICIENT_DATA to be returned due to "Insufficient Data: 1 datapoint was unknown."
aws cloudwatch put-metric-alarm \
--alarm-name high-cpu \
--alarm-description "CPU Utilization exceeds 10% in the last 5 minutes" \
--namespace AWS/EC2 \
--metric-name CPUUtilization \
--comparison-operator GreaterThanThreshold  \
--threshold 10.0 \
--unit Percent \
--statistic Average \
--period 300 \
--evaluation-periods 1 \
--treat-missing-data missing \
--datapoints-to-alarm 1 \
--dimensions "Name=InstanceId,Value=i-01234475cf14abcde" \
--alarm-actions arn:aws:sns:us-east-1:111122223333:MyTopic
Insufficient Data Actions
Be default, there are no actions for an alarm that has INSUFFICIENT_DATA. If you would like to do something, such as publishing a message to one or more of your Simple Notification Service (SNS) topics, the --insufficient-data-actions option can be used.
aws cloudwatch put-metric-alarm \
--alarm-name high-cpu \
--alarm-description "CPU Utilization exceeds 10% in the last 5 minutes" \
--namespace AWS/EC2 \
--metric-name CPUUtilization \
--comparison-operator GreaterThanThreshold  \
--threshold 10.0 \
--unit Percent \
--statistic Average \
--period 300 \
--evaluation-periods 1 \
--treat-missing-data missing \
--datapoints-to-alarm 1 \
--dimensions "Name=InstanceId,Value=i-01234475cf14abcde" \
--alarm-actions arn:aws:sns:us-east-1:111122223333:MyTopic
--insufficient-data-actions arn:aws:sns:us-east-1:111122223333:MyTopic
Dimensions for EC2 and Elastic Load Balancer
If your cloudwatch alarm is watching EC2 instances and you are creating the cloudwatch alarm using the aws cloudwatch put-metric-alarm command, --dimensions should have something like this.
--dimensions "Name=InstanceId,Value=i-01234475cf14abcde"
The aws cloudwatch describe-alarms command should have something like this.
"Dimensions": [
    {
        "Name": "InstanceId",
        "Value": "i-01234475cf14abcde"
    }
]
If your cloudwatch alarm is watching EC2 instances in an Elastic Load Balancer Target Group, ensure the target group exists.
~]$ aws elbv2 describe-target-groups
{
    "TargetGroups": [
        {
            "TargetGroupArn": "arn:aws:elasticloadbalancing:us-east-1:123456789012:targetgroup/my-target-group/cd3f676c615f2967",
            "TargetGroupName": "my-target-group"
--dimensions should have something like this.
--dimensions "Name=TargetGroup,Value=targetgroup/my-target-group/d2aeec2157e4a95d"
The aws cloudwatch describe-alarms command should have something like this.
"Dimensions": [
    {
        "Name": "LoadBalancer",
        "Value": "arn:aws:elasticloadbalancing:us-east-1:123456789012:loadbalancer/app/my-load-balancer/3c166cfc131bfa63"
    },
    {
        "Name": "TargetGroup",
        "Value": "arn:aws:elasticloadbalancing:us-east-1:123456789012:targetgroup/my-target-group/d2aeec2157e4a95d"
    }
]
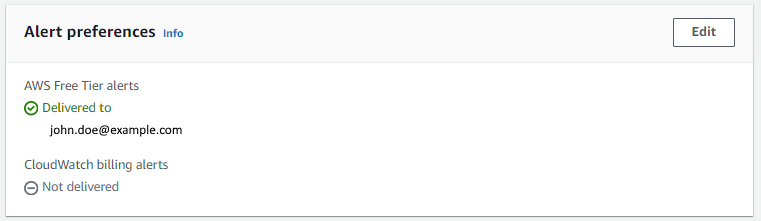
Billing Alerts
For Billing Alerts, by default, CloudWatch billing alerts are set to "Not delivered". In the AWS billing console https://console.aws.amazon.com/billing, select Billing Preferences in the left panel and update Alert preferences so that CloudWatch billing alerts are set to Delivered.
Did you find this article helpful?
If so, consider buying me a coffee over at 