ELK (Elastic Search, Logstash, Kibana) - Create Alert Rule using the REST API

by
Jeremy Canfield |
Updated: November 25 2024
| ELK (Elastic Search, Logstash, Kibana) articles
ELK is the abbreviation for (Elastic Search, Logstash, Kibana) which is a system that parses log data from one or more systems and displays the log data in a web console, used for Observability, Alerting, Logging, and Monitoring.
This assumes you are already familiar with the ELK REST API. If not, check out my article ELK (Elastic Search, Logstash, Kibana) - Getting Started with the REST API.
Let's say you have the following in a file named payload.json.
{
  "name": "jeremy test",
  "tags": [],
  "rule_type_id": "xpack.uptime.alerts.monitorStatus",
  "consumer": "alerts",
  "params": {
    "search": "monitor.project.id : \"proof_of_concept\"  AND monitor.name : *helloworld*",
    "numTimes": 1,
    "timerangeUnit": "m",
    "timerangeCount": 15,
    "shouldCheckStatus": true,
    "shouldCheckAvailability": false,
    "availability": {
      "range": 30,
      "rangeUnit": "d",
      "threshold": "99"
    },
    "stackVersion": "8.10.3"
  },
  "schedule": {
    "interval": "1m"
  },
  "actions": [
    {
      "group": "xpack.uptime.alerts.actionGroups.monitorStatus",
      "id": "cbd24d30-1f61-11ee-a49f-f95505051ebc",
      "params": {},
      "frequency": {
        "summary": false,
        "notify_when": "onActiveAlert",
        "throttle": null
      }
    }
  ]
}
The following POST request can be made to create the Alert Rule.
curl --request POST \
--header "Content-Type: application/json; Elastic-Api-Version=2023-10-31" \
--header "kbn-xsrf: true" \
--header "Authorization: ApiKey abc123" \
--url "https://elk.kb.us-east-1.aws.elastic-cloud.com/s/default/api/alerting/rule" \
--data @payload.json
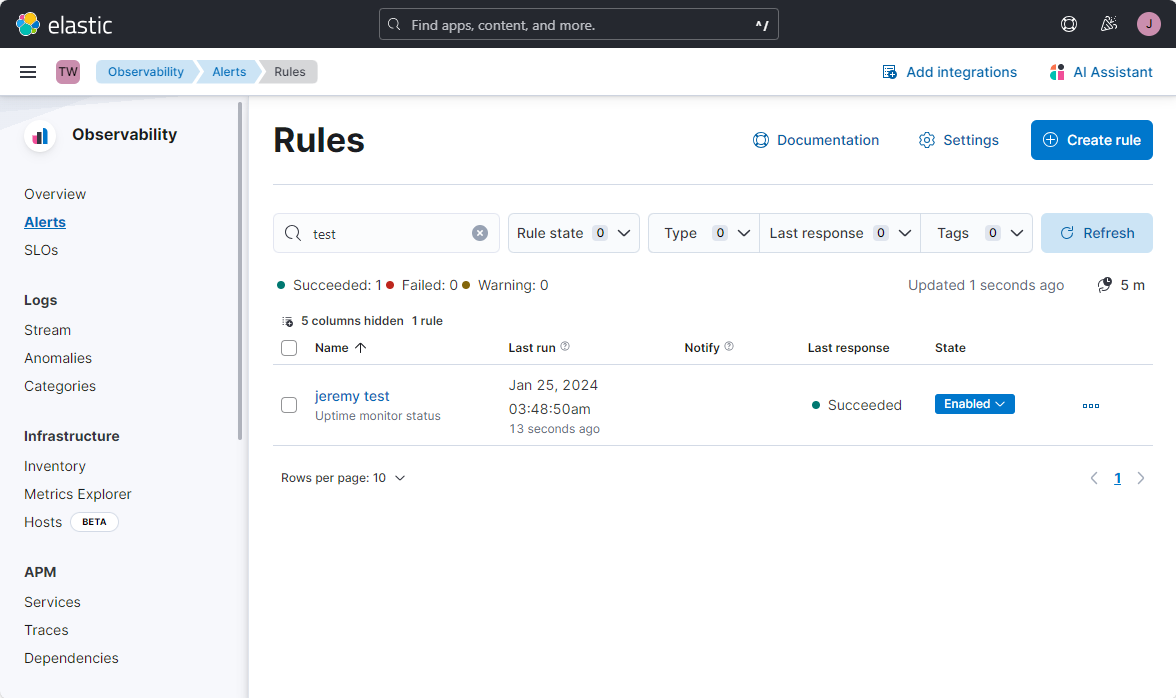
You should then see the alert in the console.
Did you find this article helpful?
If so, consider buying me a coffee over at 