
In the left panel of the DataDog console, select Integrations > AWS and select your AWS account.
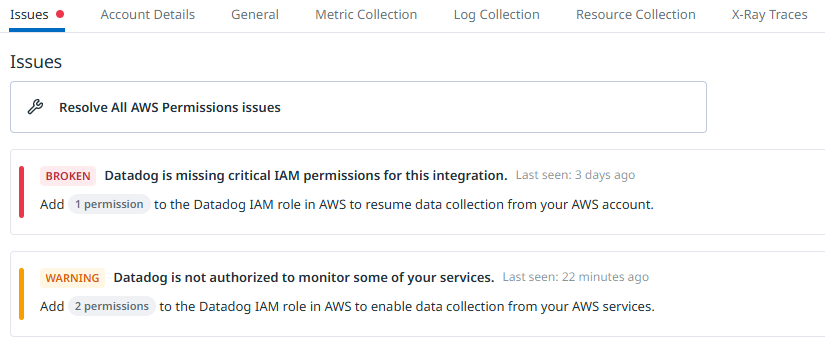
On the Issues tab, if there are issues listed, you may need to resolve the issues before proceeding.
If your Lambda Function is associated with a Cloudwatch alarm, on the General tab, ensure Collect Cloudwatch Alarms is enabled.

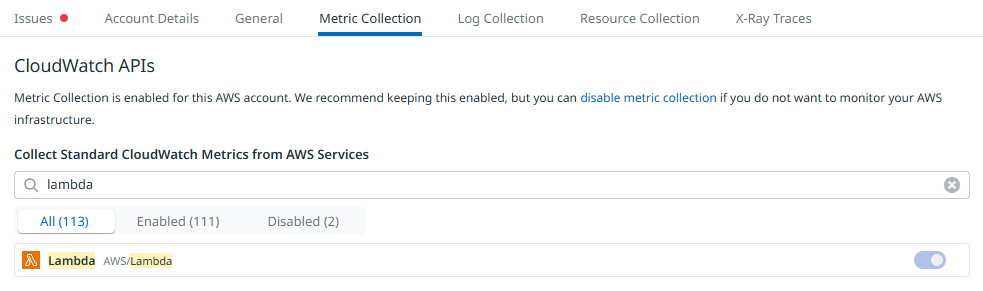
If you want DataDog to be able to display your Lambda's metrics, on the Metric Collection tab, ensure Lambda is enabled.
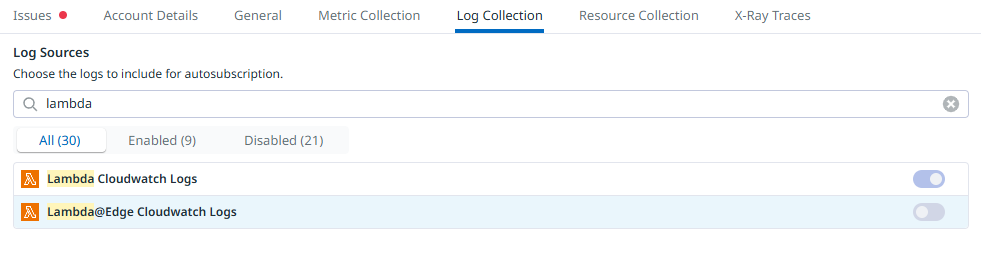
If you want DataDog to be able to display your Lambda's logs, on the Log Collection tab, ensure Lambda is enabled.
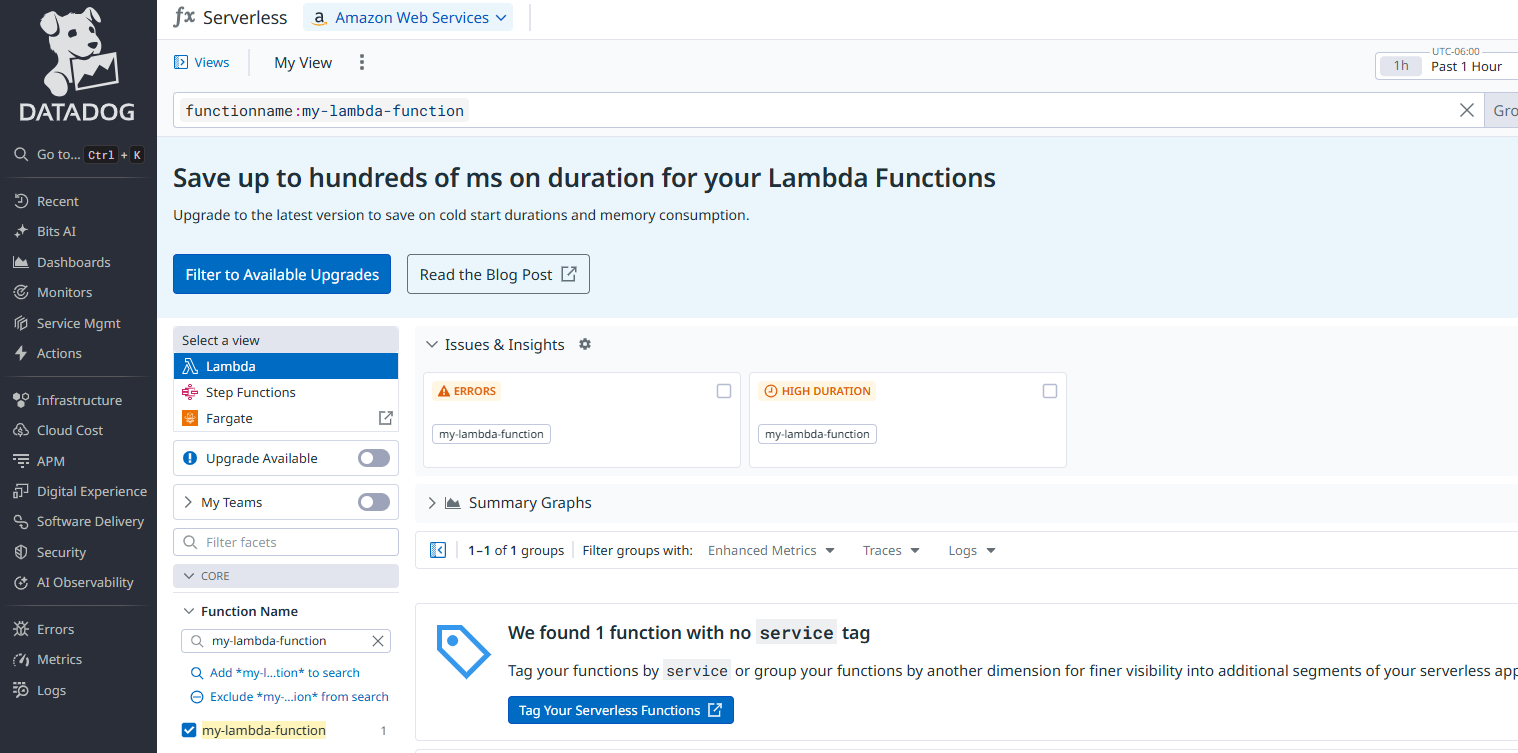
In the left panel of the DataDog console, select Infrastructure > Serverless > Lambda, and use the filter to locate your Lambda Function. Here is a screen shot showing my-lambda-function.
Did you find this article helpful?
If so, consider buying me a coffee over at 