
You may want to first read up on what is a process and what is a thread.
When a thread created by an application has been active longer than the com.ibm.websphere.threadmonitor.threadhold value, event WSVR0605W will be appended to the HPEL or SystemOut.log. In this example, there is 1 thread that has been hung for 655526 milliseconds, which is about 10 minutes. The HPEL or SystemOut.log may list events that correlate to the hung thread. In this example, you would look for events near 10 minutes prior to the hung thread event.
WSVR0605W: Thread "WebContainer : 1" (000000a1) has been active for 655526 milliseconds and may be hung.
There is/are 1 thread(s) in total in the server that may be hung.
Once the thread has been destroyed, event WSVR0606W will be appended to the HPEL or SystemOut.log.
WSVR0606W: Thread "WebContainer : 1" (000000a1) was previously reported to be hung but has completed.
Some common causes of hung threads are long database connections, some sort of system scan (such as anti-virus), or some sort of long running batch job. Not all hung threads are necessarily bad. For example, an anti-virus scan may be an OK reason for a long running thread.
Let's say an application in the application server has a search engine and a user searches for "hello world". Once the user clicks submit, a thread is created that executes a query against the SQL database. After the query has completed, the database query should be completed and the thread gets destroyed. In this example, the thread would probably have been active for no more than a few seconds. This is the ideal situation. On the other hand, let's say the database has some issue (it's down or flooded with requests). This could cause the thread to remain active for a long period of time, thus producing a hung thread situation.

If the application server is fronted by a web server, check the web server access log near the time that the request that caused the first thread to hang. If there is an event in the access log that identifies the resource that was requested (/example/search) and the user that initiated the request, and the user is in your organization, consult with the user and application developers to determine what the user was doing that caused the application to produce a hung thread.
JohnDoe /example/search
Analyze a thread dump
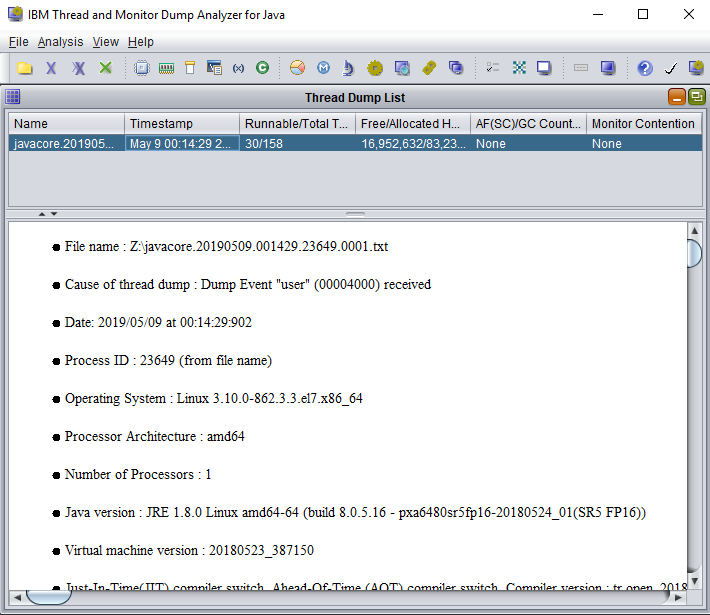
IBMs Thread and Monitor Dump Analyzer tool can also be used to analyze a thread dump.
Did you find this article helpful?
If so, consider buying me a coffee over at 