
In Introscope WebView, select the Investigator tab. Expand SuperDomain > server_hostname > server_type > your_jvm > variable > Stall Count.
By default, Introscope will display data for the last 8 minutes, and update about once every 30 seconds. Typically, you will toggle off Live monitoring, and then select a time range, such as 15 minutes, 1 hour, or 1 day.
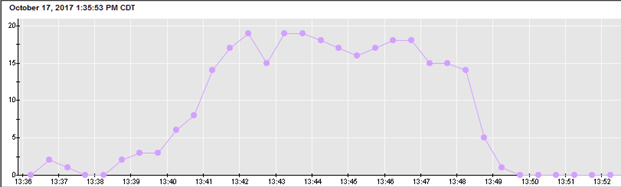
Up / Down Pattern
A stall in Introscope may be a sign of a hung thread, which means something is running for a long time, such as a database query. A stall will typically be one of two patterns. Ideally, the pattern will show an increase in stalls followed by a decrease. This is the less problematic situation, as this implies that the long running task was eventually ended (either naturally, or forced, by human intervention). The following graphs are representations of this scenario.
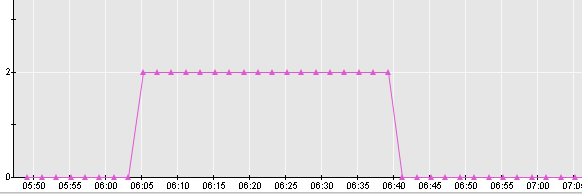
In this example, there are numerous stalls over a period of time.
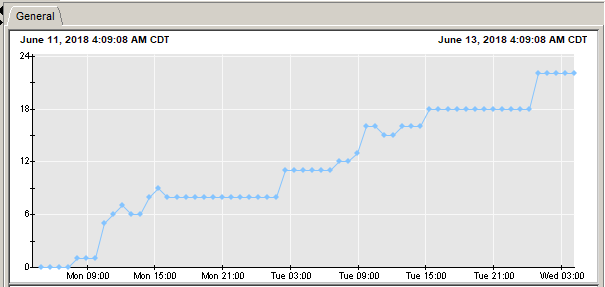
Steady Incline
The more problematic situation is when the stalls steadily increase, with no sign that the stalls will naturally be ended. This type of situation may occur after a code change is made, and the code change has produced a situation where threads are not being ended.
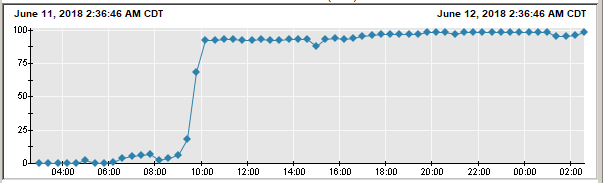
High CPU
Stall may also cause the JVM to experience high CPU utilization, which is why stalls are something that should be addressed with priority.
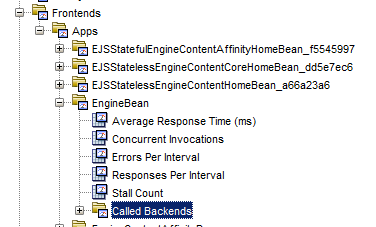
Frontend / Backend
Introscope may detect a stall in the front end (the app). However, the cause of the stall may be due to some issue on the back end (eg. database). If you are looking at the front end stalls, there may be an option such as "Called Backends". If you have this option, expand "Called Backends" to see if you can spot any backends that also are stalling.
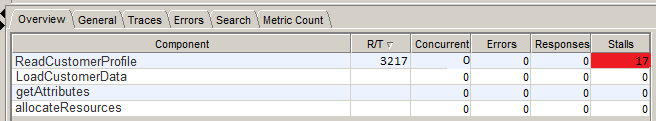
Stalling Component
Select the overview tab to identify the components that are stalling, and the stall count. In this example, the arbitrary "ReadCustomerProfile" component is stalling. Out of 3217 requests, the component stalled 17 times. In this scenario, you would look at the ReadCustomerProfile events in the application log to help spot the cause of the stalls. The JVMs log may also have information that identifies the cause of the stall, such as a hung thread in WebSphere.
Did you find this article helpful?
If so, consider buying me a coffee over at 