
Let's consider a scenario where an application needs to submit a prepared statement or callable statement (aka stored procedure) to a SQL database. In the arbitrary example, the prepared statement will insert 3 values into the employee table.
ps stmt = conn.prepareStatement("INSERT INTO employee VALUES (?,?,?)");
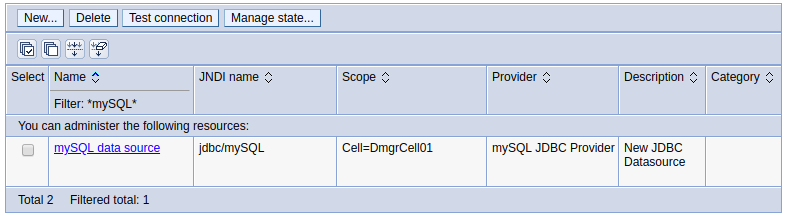
When an application that has been deployed to a WebSphere application server needs to submit the prepared statement or callable statement to a SQL database, the application will use the one of the JDBC data sources in WebSphere will be used to submit the prepared statement or callable statement. For example, lets say there is a mySQL datasource. In this example, the application would use the jdbc/mySQL JNDI to use the mySQL data source. Refer to this article for the steps on how to configured the application.
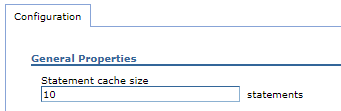
By default, a WebSphere data source cache's 10 prepared statements / callable statements. This can be seen and updated by navigating to Resources > JDBC > Data sources > your data source > WebSphere Application Server data source properties.
After the prepared statement or callable statement has been closed in the application, the prepared statement / callable statement will be cached on the WebSphere side, so that subsequent requests to submit the prepared statement or callable statement can be obtained from cache.
ps.close();
Ideally, the statement cache size should be the total number of unique prepared statements and callable statements by all of the applications using the data source. For example, if there are 3 applications using the data source, and application "a" has 10 unique statements, application "b" has 5 unique statements, and application "c" has 10 unique statements, then the statement cache size should be 25. If the statement cache size is less than the total number of unique prepared statements and callable statements in the application, this could result in the oldest statement being discarded from the cache when a new statement is requested.
You do not want to set the number of cached prepared statements to an unnecessarily high value as this would be a waste of system resources (CPU, memory) and could ultimately result in reduced performance.
Tivoli Performance Viewer can be used to determine if there are any cache discards. When Performance Monitoring Infrastructure (PMI) is set to Basic, PrepStmtCacheDiscardCount metrics are not captured, which means that in Basic mode, Tivoli Performance Viewer will not be able to report on cache discards. Updating Performance Monitoring Infrastructure to Extended, Custom, or All will allow you to capture PrepStmtCacheDiscardCount.

Once PrepStmtCacheDiscardCount is being captured as PMI data, then at Tivoli Performance Viewer Summary Reports > JDBC Connection Pools, you will be able to select PrepStmtCacheDiscardCount to determine if there are any cache discards.

Did you find this article helpful?
If so, consider buying me a coffee over at 