IBM WebSphere - Monitoring threads

by
Jeremy Canfield |
Updated: March 08 2020
| IBM WebSphere articles
You may want to first read up on what is a process and what is a thread and thread pools in WebSphere.
The Tivoli Performance Monitor can be used to view the number of threads being used in a pool.
- In the WebSphere admin console, select Monitoring and Tuning > Performance Viewer > Current activity.
- Select an application server.
- Expand Summary Reports > Thread Pool.
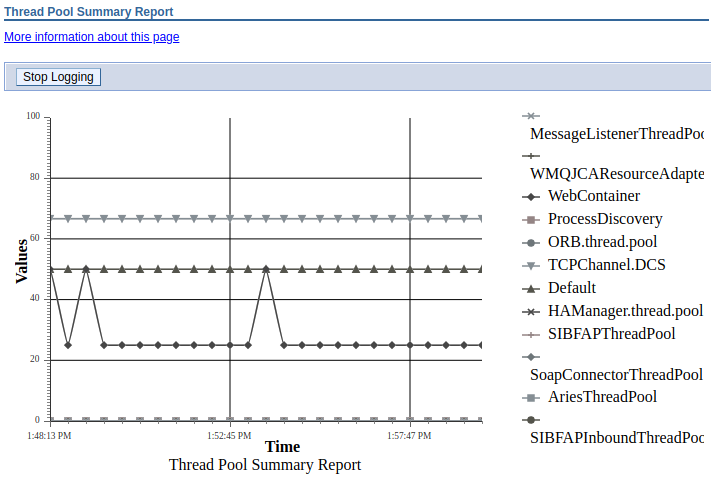
In this example, the graph shows a spike when threads in the WebContainer thread pool are in use.
Did you find this article helpful?
If so, consider buying me a coffee over at 