
You may want to first read up on what is a process and what is a thread.
When a system alarm thread has been active longer than the com.ibm.websphere.alarmthreadmonitor.threadhold.millis value, event UTLS0008W will be appended to the HPEL or SystemOut.log. In this example, there is 1 thread that has been hung for 11495 milliseconds, which is just over 10 seconds. The HPEL or SystemOut.log may list events that correlate to the hung thread. In this example, you would look for events near 10 seconds prior to the hung thread event.
UTLS0008W: The alarm thread threadname has been active for 11495 milliseconds and may be hung.
Once the thread has been destroyed, event UTLS0009W will be appended to the HPEL or SystemOut.log.
UTLS0009W: Alarm Thread threadname was previously reported to
be hung but has completed.  It was active for approximately
15436 milliseconds.
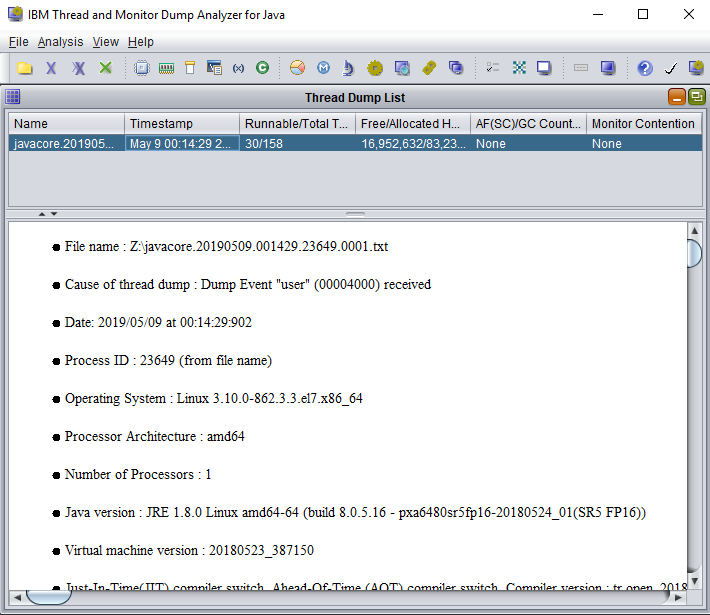
Analyze a thread dump
IBMs Thread and Monitor Dump Analyzer tool can also be used to analyze a thread dump.
Did you find this article helpful?
If so, consider buying me a coffee over at 