
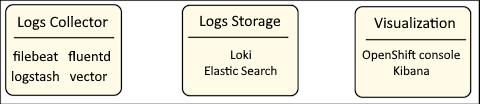
Logging in OpenShift is separated into different systems and services that serve a specific purpose.
- Collecting log data - typically done with filebeat, fluentd, logstash or vector
- Storing log data, for example, in an Amazon Web Services (AWS) S3 Bucket - typically done with Loki or Elastic Search
- Visualizing and query log data - typically done in the OpenShift console or in Kibana
There are abbreviations used as shorthand for the collection of systems and services to collect, store and visualize log data.
- EFK (Elastic Search, Fluentd, Kibana)
- ELK (Elastic Search, Logstash, Kibana)
- EVK (Elastic Search, Vector, Kibana)
- LFK (Loki, Fluentd, Kibana)
- LLK (Loki, Logstash, Kibana)
- LVK (Loki, Vector, Kibana)
The first step in configuring OpenShift to collect log data from various different types of resources in your OpenShift cluster, such as nodes, pods, and so on is to install an Operator that will collect the log data. This is often done by installing the Cluster Logging Operator. Check out my article OpenShift - Getting Started with Cluster Logging.
The oc get operators command can be used to list the installed Operators. In this example, the Loki and Elasticsearch and OpenShift Cluster Logging Operators have already been installed.
~]$ oc get operators
NAME                                                              AGE
cluster-logging.openshift-logging                                 604d
elasticsearch-operator.openshift-operators-redhat                 604d
loki-operator.openshift-operators-redhat                          181d
The oc get configmap command can be used to list the configmaps in the openshift-logging project. The fluentd configmap should contain the fluentd.conf file.
~]$ oc get configmap --namespace openshift-logging
NAME                            DATA   AGE
cluster-logging-operator-lock   0      55d
curator                         3      141d
elasticsearch                   3      141d
fluentd                         2      141d
fluentd-trusted-ca-bundle       1      141d
indexmanagement-scripts         6      141d
kibana-trusted-ca-bundle        1      141d
The oc describe configmap command can be used to display the content of the fluentd configmap / fluentd.conf file. In this example, fluentd is configure to log events at log level warn. In this example, events at log levels warn, error and fatal will be logged.
~]$ oc describe configmap/fluentd --namespace openshift-logging | grep -i log_level
  log_level "#{ENV['LOG_LEVEL'] || 'warn'}"
Here are the possible fluentd log levels.
- fatal
- error
- warn
- info
- debug
- trace
The oc get pods command can be used list the Fluentd pods in the openshift-logging project.
oc get pods -n openshift-logging
Something like this should be returned.
NAME                                            READY   STATUS      RESTARTS   AGE
cluster-logging-operator-7f65964859-gtlvv       1/1     Running     0          50d
curator-1622518200-qpnfc                        0/1     Error       0          9d
curator-1623295800-h658p                        0/1     Completed   0          22h
elasticsearch-cdm-dm8dl5ki-1-5d4d54988f-qzz4x   2/2     Running     0          50d
elasticsearch-cdm-dm8dl5ki-2-674f9db4c6-k4r2x   2/2     Running     0          37d
elasticsearch-cdm-dm8dl5ki-3-7d55fbfbff-8ssnk   2/2     Running     0          50d
elasticsearch-im-app-1623377700-2xnxv           0/1     Completed   0          7m57s
elasticsearch-im-audit-1623377700-bsrcl         0/1     Completed   0          7m57s
elasticsearch-im-infra-1623377700-5ltdm         0/1     Completed   0          7m57s
fluentd-22pbq                                   1/1     Running     0          50d
fluentd-44v9v                                   1/1     Running     0          50d
fluentd-6lpwh                                   1/1     Running     0          50d
fluentd-89xsl                                   1/1     Running     0          50d
fluentd-995zv                                   1/1     Running     0          50d
fluentd-b5vj7                                   1/1     Running     0          50d
fluentd-bc4zg                                   1/1     Running     0          50d
fluentd-br7ft                                   1/1     Running     0          50d
fluentd-cmnqr                                   1/1     Running     0          50d
fluentd-gc6zv                                   1/1     Running     0          50d
fluentd-gl68p                                   1/1     Running     0          50d
fluentd-gplgt                                   1/1     Running     0          50d
fluentd-kbvx8                                   1/1     Running     0          50d
fluentd-kgzvm                                   1/1     Running     0          50d
fluentd-kzpjk                                   1/1     Running     0          50d
fluentd-nbm9v                                   1/1     Running     0          50d
fluentd-pd287                                   1/1     Running     0          50d
fluentd-rml9r                                   1/1     Running     0          50d
fluentd-vj7mw                                   1/1     Running     0          50d
fluentd-vp5jq                                   1/1     Running     0          50d
fluentd-x5j5g                                   1/1     Running     1          50d
fluentd-xl257                                   1/1     Running     0          50d
fluentd-xpw7s                                   1/1     Running     0          50d
fluentd-xttg7                                   1/1     Running     0          50d
fluentd-zdn6j                                   1/1     Running     0          50d
fluentd-zh2vc                                   1/1     Running     0          50d
kibana-7b676c4bf8-d9t6w                         2/2     Running     0          50d
The oc exec command can be used to examine the content of the fluentd.conf file in the pod.
~]$ oc exec fluentd-2xwsk --namespace openshift-logging -- grep -i log_level /etc/fluent/configs.d/user/fluent.conf
  log_level "#{ENV['LOG_LEVEL'] || 'warn'}"
Did you find this article helpful?
If so, consider buying me a coffee over at 