
The oc adm top command can be used to display the current, real time amount of CPU and memory being used by nodes.
~]$ oc adm top node
NAME                       CPU(cores)   CPU%   MEMORY(bytes)   MEMORY%
my-edge-78v55              139m         3%     5634Mi          65%
my-edge-tk6gm              143m         4%     5514Mi          63%
my-infra-7hpsl             751m         13%    12094Mi         24%
my-infra-jld8v             1091m        19%    45008Mi         92%
my-infra-wxjgn             323m         5%     12444Mi         25%
my-master-0                499m         6%     15022Mi         23%
my-master-1                647m         8%     15334Mi         24%
my-master-2                327m         4%     11125Mi         17%
my-worker-4ccvr            195m         5%     6821Mi          11%
my-worker-flbcp            181m         5%     8027Mi          13%
my-worker-jchnk            178m         5%     8204Mi          13%
And by pods in the currently selected namespace.
~]$ oc adm top pods
NAME                        CPU(cores)   MEMORY(bytes)
my-pod-5ff96b69cd-v6pv5     1m           36Mi
my-pod-66f68d8884-vbp6g     0m           121Mi
my-pod-84d6fdb8c-5zczs      1m           221Mi
Or in a specific namespace.
~]$ oc adm top pods --namespace my-project
NAME                        CPU(cores)   MEMORY(bytes)
my-pod-5ff96b69cd-v6pv5     1m           36Mi
my-pod-66f68d8884-vbp6g     0m           121Mi
my-pod-84d6fdb8c-5zczs      1m           221Mi
Or in all namespaces.
~]$ oc adm top pods --all-namespaces
NAMESPACE          NAME                          CPU(cores)   MEMORY(bytes)
foo-project        my-pod-7478b76dcc-2ql98       1m           77Mi
foo-project        my-pod-5ffbb5f99-vclqf        1m           9Mi
foo-project        my-pod-94d49d56d-n9g26        1m           42Mi
bar-project        my-pod-7cf56894f6-5w4qp       1m           167Mi
bar-project        my-pod-56d6b9b59c-j5z7b       1m           22Mi
bar-project        my-pod-5d47f598cb-cc5nd       1m           53Mi
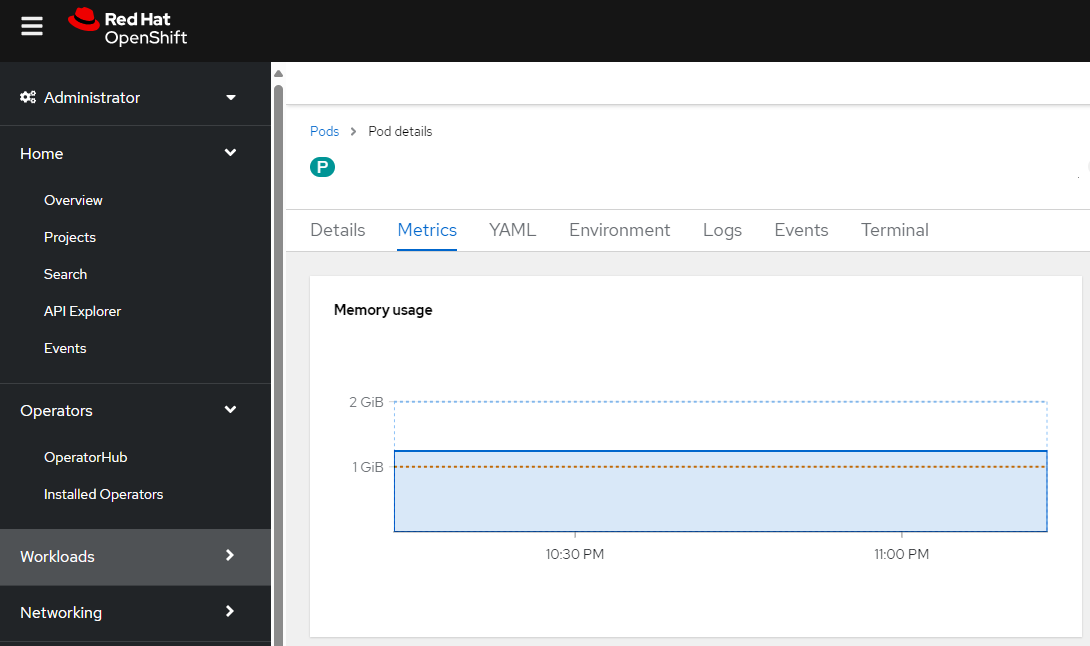
While it is possible to determine the amount of memory being used by a pod on the command line, I almost never use the command line for this, and instead use the OpenShift console. This is just something that is so much easier to do using the console.
Likewise, in the OpenShift console, at Home > Projects, you can select a project/namespace. Then select Pods and select a pod. Then select the Metrics tab and the Memory usage graph will be displayed. You can then click on the Memory usage graph to get a more details graph of the pods memory usage.
Or the oc get pods command with the --output yaml option can be used to determine the memory and CPU requests and limits for the pod.
oc get pod/my-pod-9mzm2 --output yaml
Something like this should be returned.
- requests = the amount of memory / CPU that is reserved or allocated for the container. If a container exceeds its memory limit, the container will should be terminated.
- limit = the maximum amount of memory / CPU the container can request. If a container exceeds its memory request, its pod should be evicted if the node the pod is running on runs out of memory.
spec:
  containers:
    resources:
      limits:
        cpu: 500m
        memory: 512Mi
      requests:
        cpu: 10m
        memory: 256Mi
The oc exec command can be used to get the real time memory usage in bytes of the pod.
oc exec my-pod-9mzm2 -- cat /sys/fs/cgroup/memory/memory.usage_in_bytes
Something like this should be returned. In this example, the pod is currently using 568414208 bytes of memory (568 MB).
568414208
And here is how you can return the CPU statistics.
~]$ oc exec my-pod-9mzm2 -- cat /sys/fs/cgroup/cpu/cpuacct.stat
user 289
system 58
And here is how you could divide the bytes by 1024 to get the value in KB.
~]$ bytes=$(oc exec my-pod-9mzm2 -- cat /sys/fs/cgroup/memory/memory.usage_in_bytes); echo $(($bytes / 1024))
83180
Or in MB.
~]$ bytes=$(oc exec foo-9mzm2 -- cat /sys/fs/cgroup/memory/memory.usage_in_bytes); echo $(($bytes / 1024 / 1024 ))
96
Did you find this article helpful?
If so, consider buying me a coffee over at 