
- In the Introscope investigator, select the Metric Browser tab.
- Expand SuperDomain > server_hostname > server_type > your_jvm > CPU.
By default, Introscope will display data for the last 8 minutes, and update about once every 30 seconds. Typically, you will toggle off Live monitoring, and then select a time range, such as 15 minutes, 1 hour, or 1 day.
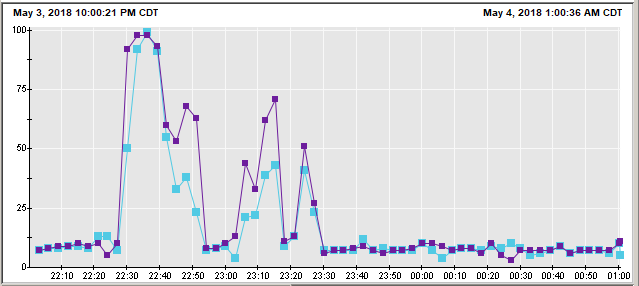
In this example, the JVM had high CPU usage from 22:25 to 23:30, which is 1 hour, and then the CPU average returned to around 5%. This is usually an indication of something planned or routine causing the high CPU, such as a scheduled job.
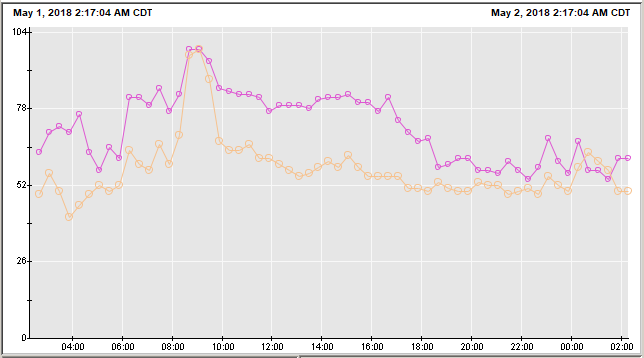
In this example, the CPU consistenly hover around 50% to 75%, for 24 hours. This would certainly warrant analysis.
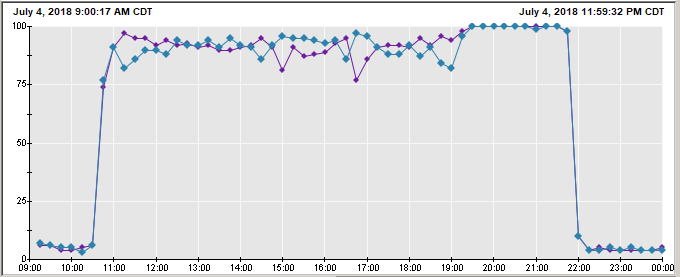
In this example, CPU was low, then almost immediately reached 100% utilization. After the issue that was causing the CPU to be high was resolved, CPU returned to normal. Obviously, when CPU is 100%, you absoultely need to figure out why the CPU utilization has spiked.
Is high CPU repetitive?
Check to see if the servers high CPU utilization is repetitive. For example, the server may be running some sort of scheduled job daily, weekly, or monthly that causes the high CPU. Change the custom range to the same time period 1 and 7 days ago, and also the same date last month, to see if the high CPU is routine. If so, you may be able to ignore the high CPU, as the high CPU may be expected.
Linux high CPU
If the server is Linux, refer to troubleshooting high CPU in Linux.
JVMs (WebSphere / Tomcat)
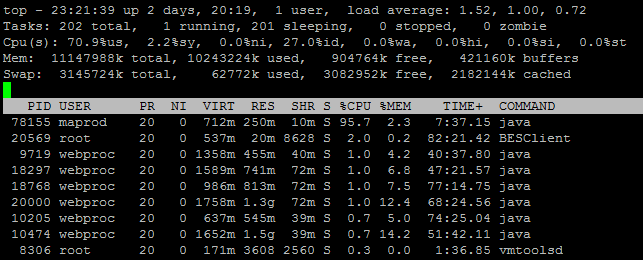
If the operting system is running an application server, such as WebSphere or Tomcat, Java may be the cause of high CPU. In this example, the java process is using 95% of the CPU. JVMs (Java Virtual Machines) may produce high CPU.
If there is more than one JVM on the system, using the following command to determine the JVM associated with the Java process that has high CPU.
ps <PID> | sed 's| |\n|g'
On WebSphere, the JVMs SystemOut.log can be used to know what PID the JVM is using (12345 in this example).
********** Start Display Current Environment **********
WebSphere Platform x.x.x.x running with process named cell\node\jvm and process id 12345
Once you know the JVM that is using the majority of the CPU, determine if one or more of the apps in the JVM are writing a large amount of events to apps log, as this can use up substantial CPU. If this is the case, you would need to determine why the app is writing a large amount of events to the apps logs.
If no app logs are large, check the JVMs log near the start of the high CPU to see if there are faults in the log that correlate to the high CPU.
When you determine that a JVM is the cause of the high CPU, pay attention to the high CPU duration. When there is a long duration of high CPU, you may want to restart the JVM to see if a restart remedies the high CPU. On the other hand, you usually do not want to restart the JVM for short spikes of high CPU.

If nothing is found in the JVM logs, check for garbage collection problems in Introscope.
If the JVMs Java process consistently uses high CPU, you may want to consider adding another JVM to the cluster (this assumes the JVMs are already in a cluster).
Did you find this article helpful?
If so, consider buying me a coffee over at 