
- In the Introscope investigator, select the Metric Browser tab.
- Expand SuperDomain > server_hostname > server_type > your_jvm > GC Heap.
By default, Introscope will display data for the last 8 minutes, and update about once every 30 seconds. For this analysis, you will definitely want to toggle of Live, and then select a custom range of about 1 hour.
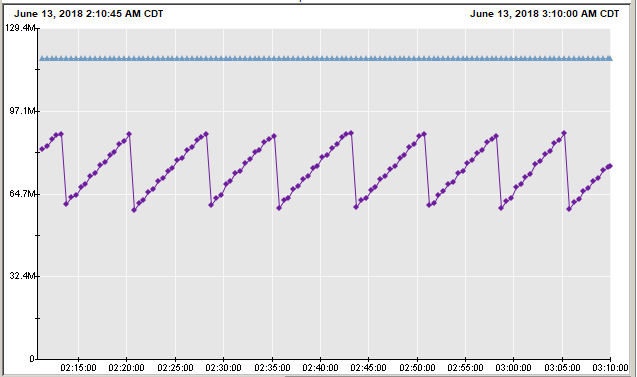
Saw Tooth Pattern
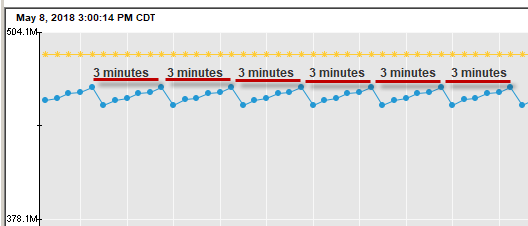
When garbage collection is working as expected, you would expect to see a sort of saw tooth pattern. In this example, the saw tooth pattern is absolutely ideal. This is not common with an app that is being used. This type of pattern is what you would expect to see when the app has little to no activity.
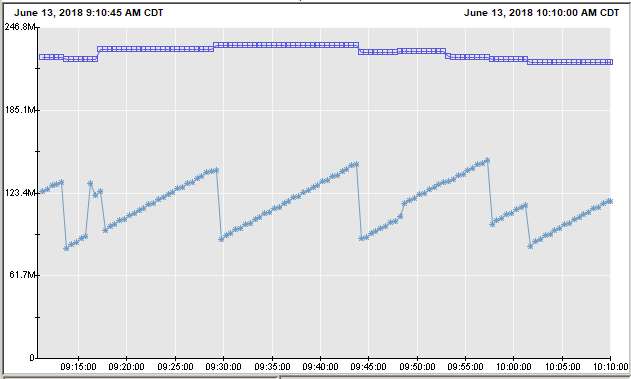
When an app is being used, you should still be able to see a saw tooth pattern. However, the pattern will not be as consistent. This is still OK.
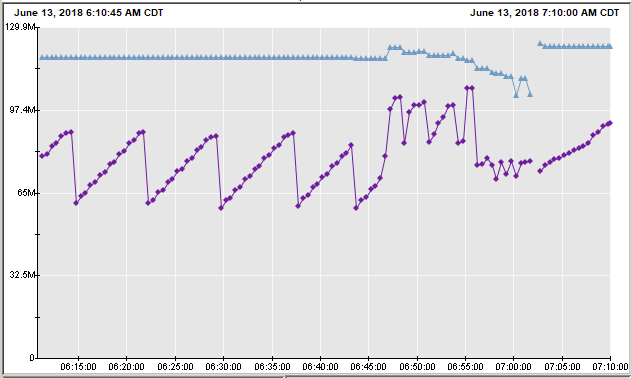
What you are looking out for is when the saw tooth pattern becomes erradic. An erradic pattern may be an indication of some issue, such as the JVM moving towards an out of memory situation. When you see an unexpected and inconsistent pattern, check the JVM logs to see if you can spot an issue with the JVM.
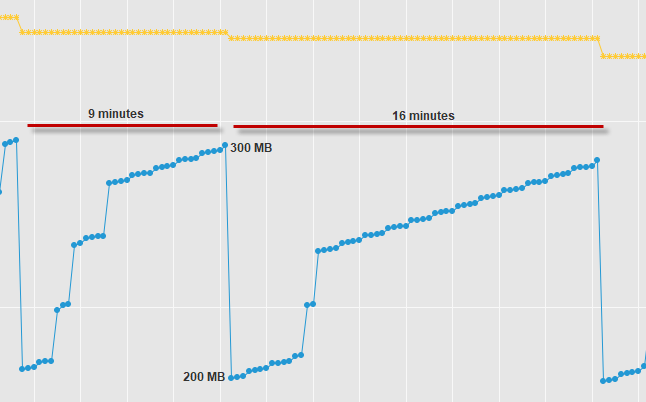
Garbage Collection Frequency
A complex and popular app will have more frequent garbage collection than a simple and unpopular app, so there isn't a magic interval for how often garbage collection should occur, and how many MB of objects should be removed from the heap. However, generally speaking, if the app is complex and popular, garbage collection once every 10 minutes or so is probably OK, with a removal of about 100 MB of objects.
On the other hand, if garbage collection is occurring very often, and only a few MB of objects are being removed by the garbage collector, there are a few possibilites.
- Large Footprint - An application may simply have a large footprint, meaning that the application is placing a large number of objects in the heap. In this example, the initial heap size is 512 MB, and the average heap usage is near 450 MB, meaning that the application(s) on the JVM are using nearly all of the heap. There is no steady incline, meaning there is not a memory leak. In this example, it probably makes sense to increase the maximum heap size.
- Code Problem - There may be a problem with the code of the Java app where objects that are no longer needed are not being let go by the app. This would require a review of the code of the Java app to determine what code may be the cause of this problem.
Analyze the garbage collection log
IBMs Garbage Collector and Memory Visualizer can be used to analyze a WebSphere garbage collection file (native_stderr.log). IBMs tool can be installed as a tool in IBMs Support Assistant Team Server. Refer to How to analyze WebSphere native_stderr.log or native_stdout log.
On Tomcat, the gc.log contains the measurement of how much time it took the JVM to perform garbage collection. In the gc.log will be lines that contain the time measurements.
[Times: user=0.09 sys=0.00, real=0.14 secs]
What you want to do is to get the average of the "real" time measurements. This could be done using these commands.
# total time spent in garbage collection
totalGC=$(strings gc.log | grep "GC (" | awk -F'[' '{print $NF}' | awk '{print $4}' | sed 's|real=||' | awk '{s+=$1} END {print s}');

GCcount=$(strings gc.log | grep "GC (" | awk -F'[' '{print $NF}' | awk '{print $4}' | sed 's|real=||' | wc -l);

calc(){ awk "BEGIN { print "$*" }"; };

averageGC=$( calc $totalGC/$GCcount);

echo "Average time spent in Garbage Collection = "$averageGC "seconds";
Did you find this article helpful?
If so, consider buying me a coffee over at 