
This assumes you have enabled verbose garbage collection. IBMs Garbage Collection and Memory Visualizer can be used to analyze the garbage collection logs (native_stderr.log, native_stdout.log).
- Install Garbage Collection and Memory Visualizer tool in Eclipse
- Install Garbage Collection and Memory Visualizer tool in IBM Support Assistant (ISA)
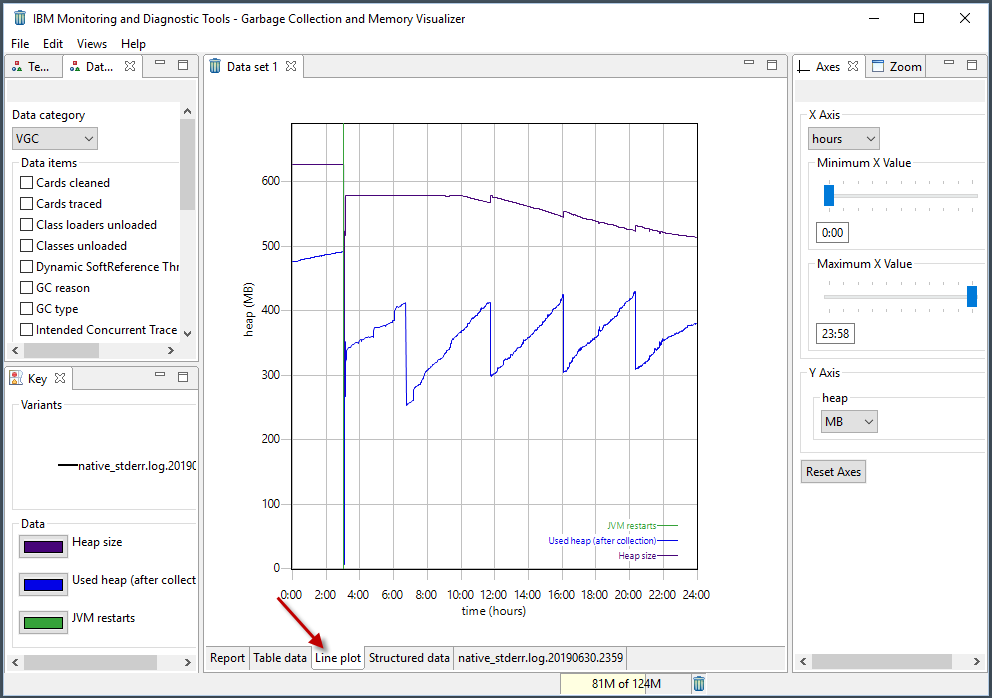
In the Garbage Collection and Memory Visualizer tool, select File > Load File. Select the native_stderr.log or native_stdout.log file you will like to analyze. After the log has been parsed, you will be on the Line plot tab and a graph displaying the garbage collection cycles will be displayed. If No data parsed from sources is displayed, this means the log file being loaded is not a valid log file.
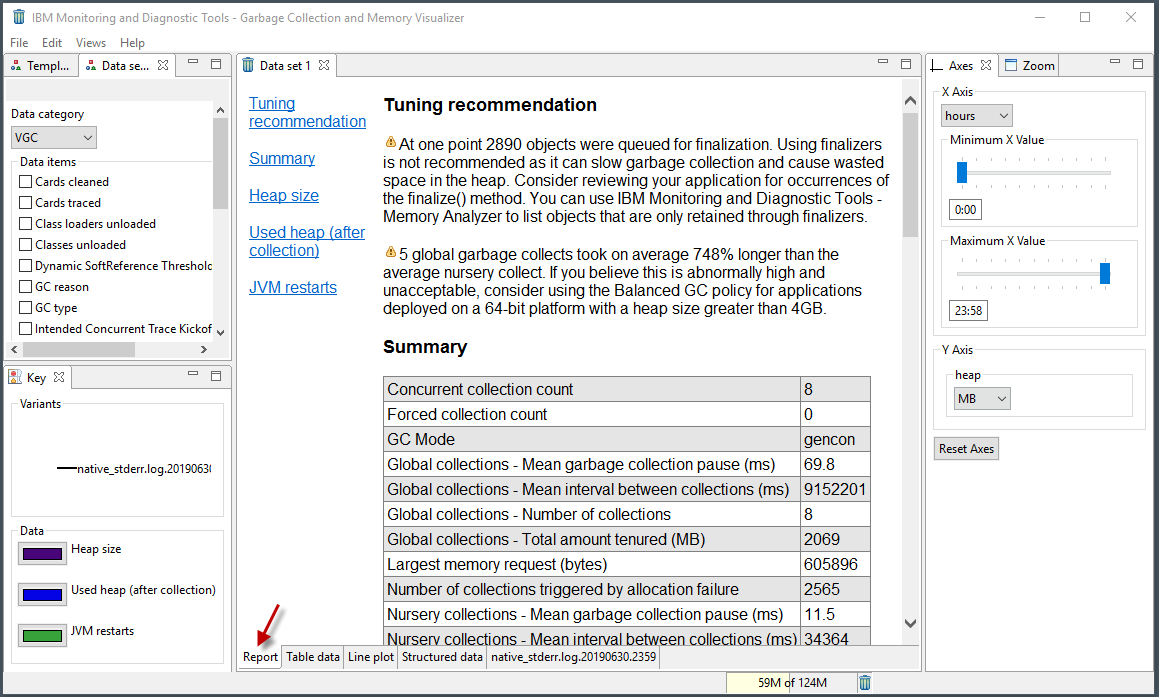
At the bottom of the GUI, select the Report tab. This will display tuning recommendations (recommendations is the key word here - the recommendations require contemplation to conclude if the recommendation makes sense) and a summary.
Following are the steps for known recommendations.
- At one point x objects were queued for finalization
- Excessive time (x.xx%) is being spent in GC
- The mean heap unusable due to fragmentation
- The mean occupancy is x%
- x global garbage collects took on average x% longer than the average nursery collect
It is usually a good idea to compare at least a few of the log's, to see if the tuning recommendations in each log are similar or different. And, it is a best practise to rotate the native_stderr.log and native_stdout.log.
Did you find this article helpful?
If so, consider buying me a coffee over at 