
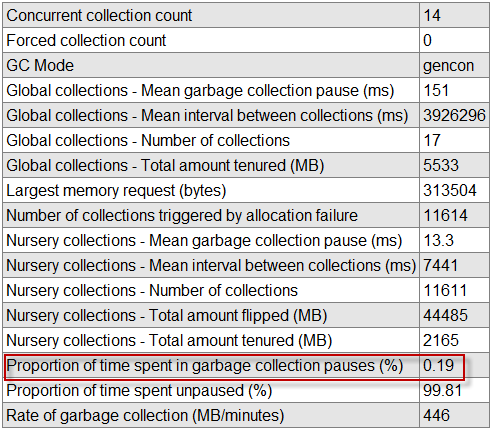
This assumes you have analyzed a native_stderr.log in Garbage Collection and Memory Visualizer, and one of the tuning recommedations is "Excessive time (x.xx%) is being spent in GC. Consider increasing the size of the heap".
The heap size determines how often and how long a JVM does garbage collection. When the maximum heap size is large, garbage collection will occur less frequently but will take longer. When the maximum heap size is small, garbage collection will occur more often but will take less time. Garbage collection negatively impacts a JVMs performance, so the goal is to find the heap size that cause the least performance hit. Typically, the proportion of time spent in garbage collection pauses should be less than 1%.
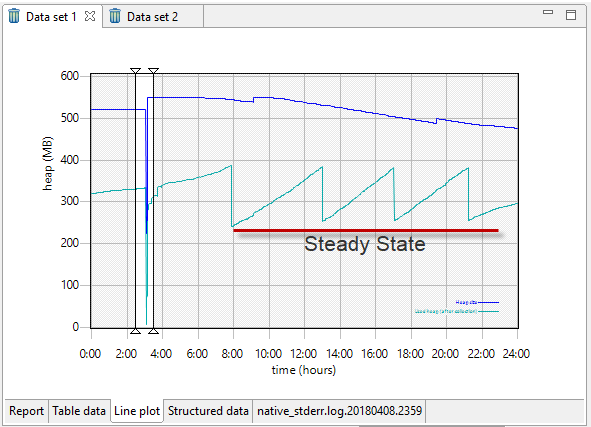
If the proportion of time spent in garbage collection pauses is greater than 1%, determine the steady state after the JVM is restarted. For this, you will need to get the native_stderr.log when the JVM was last restarted. In this example, the JVM was restarted around 3:00 am, and the steady state is near 250 MB, which means a minimum heap size of 256 MB would be appropriate.
Since a large maximum heap size will cause garbage collection to occur less often but will take longer, you don't want to set the maximum heap size to be unnecessarily large. What you want to do is to set the maximum heap to be larger than the minimum heap, and to then measure JVM performance.
Did you find this article helpful?
If so, consider buying me a coffee over at 