
Tracing is used when you are attempting to debug a specific feature of WebSphere. For example, let's say some issue is occurring when attempt to stop or start an application server or there are SSL errors in the HPEL or SystemOut log.
In the left panel of the WebSphere admin console, expand Troubleshooting and select Logs and trace. Select the deployment manager, node agent, or application server that you want to enable tracing on. Select Change log level details. By default, the log level should be *=info.
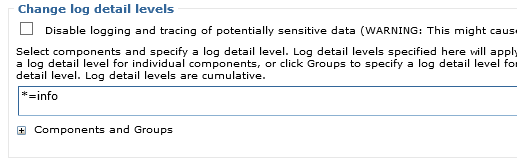
For example, to debug an SSL issue, you would set the log level to *=info:SSL=all.
*=info:SSL=all
Or to debug JMS issues, such as an issue connecting to IBM MQ.
*=info:jmsApi=all:Messaging=all:com.ibm.mq.*=all:JMSApi=all
javax.net.debug
You may also want to configure the application servers to log javax.net.debug events to the HPEL or SystemOut log. Select Servers > All servers > your application server > Java and process management > process definition > Java Virtual Machine > Custom properties > New and create the following.
- Name = javax.net.debug
- Value = true
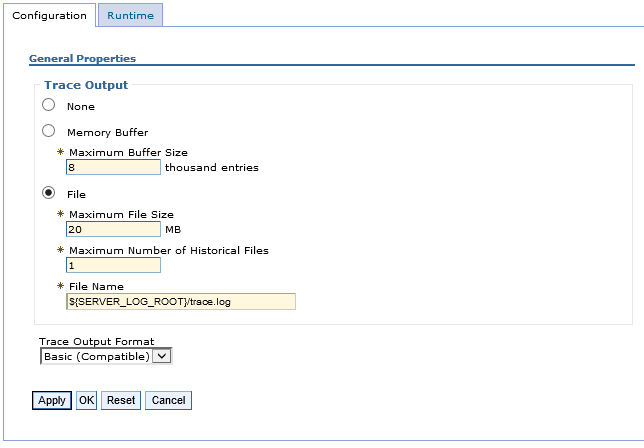
Restart your application server, and debug/tracing events should be appended to the trace.log. In this example, the trace log should be located at ${SERVER_LOG_ROOT}/trace.log. Note that ${SERVER_LOG_ROOT} is a global WebSphere variable defined at Environment > WebSphere variables and also at Troubleshooting > Logs and trace > your server > Diagnostic Trace.
Or, the -trace flag can be used with certain commands. For example, let's say some issue is occurring when attempt to stop or start an application server. The -trace flag can be used along with the stopServer.sh and startServer.sh commands to add tracing events to trace.log.
${was_install_root}/profiles/your_profile/bin/stopServer.sh server01 -trace
${was_install_root}/profiles/your_profile/bin/startServer.sh server01 -trace
Often, IBM might also ask you to provider a must gather / collector.
Did you find this article helpful?
If so, consider buying me a coffee over at 