
Eclipse Memory Analyzer (MAT) is a tool that is used to analyze a heap dump.
This assumes you have:
In Eclipse Memory Analyzer, select File > Open a Heap Dump and select the heap dump file. The heap dump file should end with the .hprof extension (e.g. java_pid3158.hprof).
Note: It is important to recognize that the heap dump file must have file extension HPROF. By default, a WebSphere heap dump has file extenion PHD (Portable Heap Dump), which means that by default, a WebSphere heap dump cannot be analyzed by Eclipse Memory Analyzer. To be able to analyze a WebSphere PHD file, you will need to install the IBM Diagnostic Tool Framework for Java (DTFJ) feature. Click here for instructions on how to add the IBM Diagnostic Tool Framework for Java (DTFJ) feature to Eclipse Memory Analyzer.
Once opened, the default view should display a pie chart.
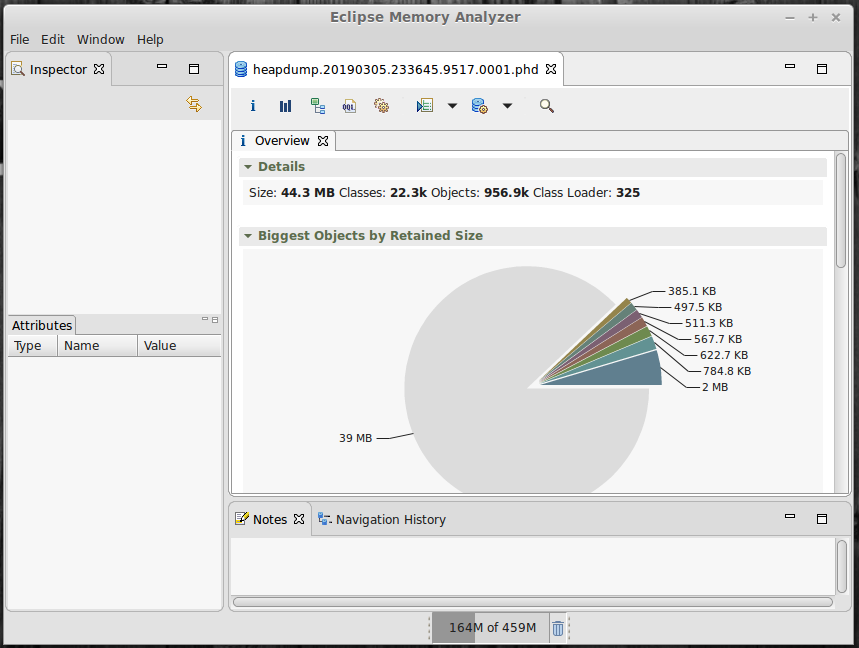
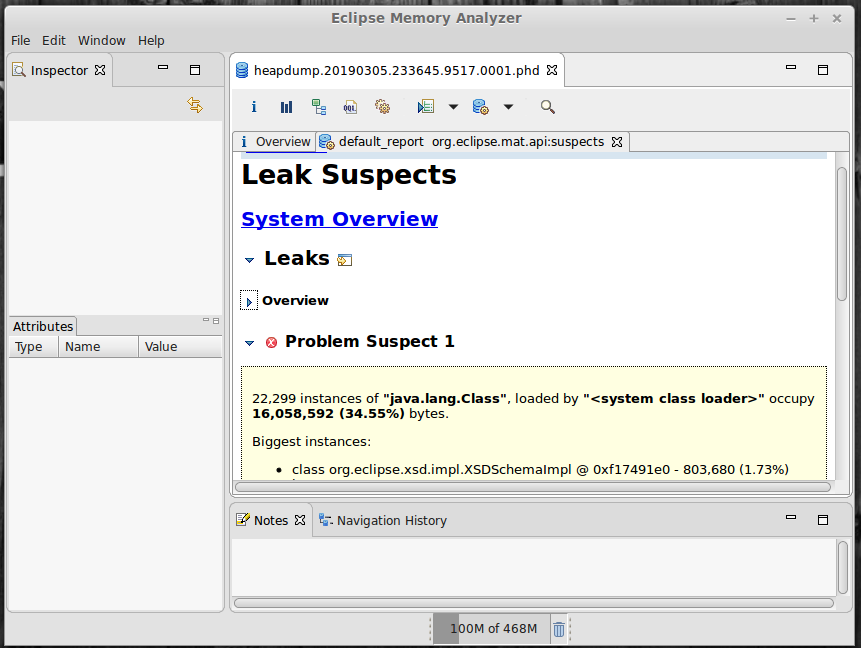
Probably the most useful view in the tool is Run Expert System Test > Heap Dump Overview and Run Expert System Test > Leak Suspects. For example, the Leak Suspects view identifies the classes in the heap dump that may be producing a memory leak.
Be aware that a number of files will be created in the same directory as the heapdump file being analyzed. The files will start with the text "heapdump". The files can be deleted after the heap dump has been analyzed.
Did you find this article helpful?
If so, consider buying me a coffee over at 