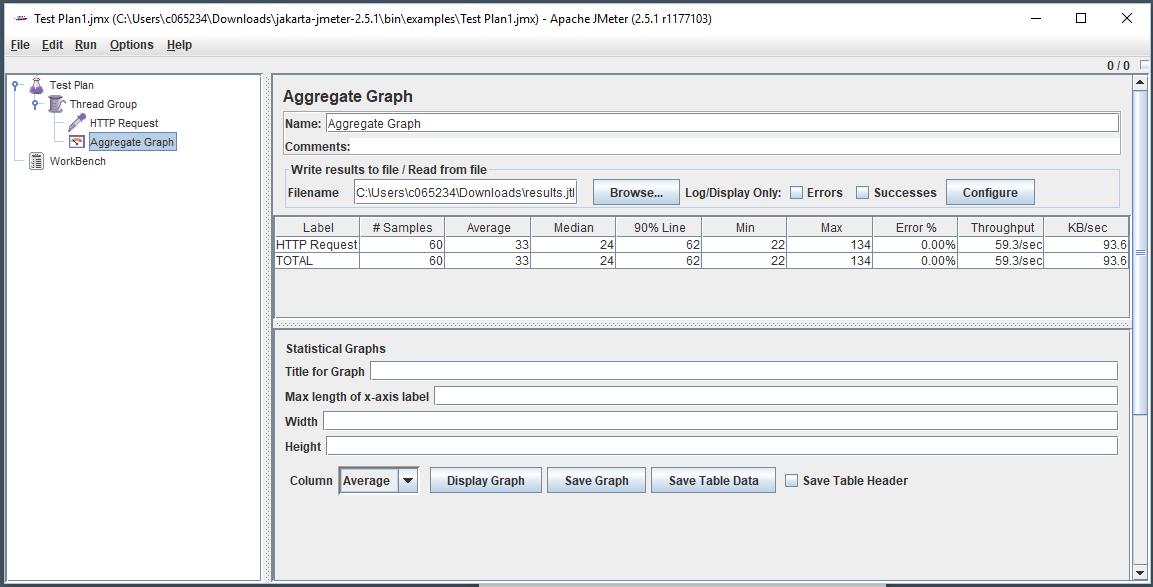
This assumes you have downloaded and installed JMeter and you have created your Test Plan .jmx file and that you have run your test. If you have done these things, then your test results should be stored in a file named results.jtl.
There are different ways to view the results. You can view the results as a graph, you can view the results in a table (rows, column), you can create an XML file of the results, et cetera. Let's configure our test plan so that the results can be viewed in a table.
In the left panel of the JMeter GUI, right-click on Thread Group and select Add > Listener, and choose one of the available options. I find Aggregate Graph to be a pretty good first graph to use as this graph gives you some data and a big picture idea of the result of the test. Select Browse, select the JTL file, and the result of the performance test will be displayed.

Did you find this article helpful?
If so, consider buying me a coffee over at 