
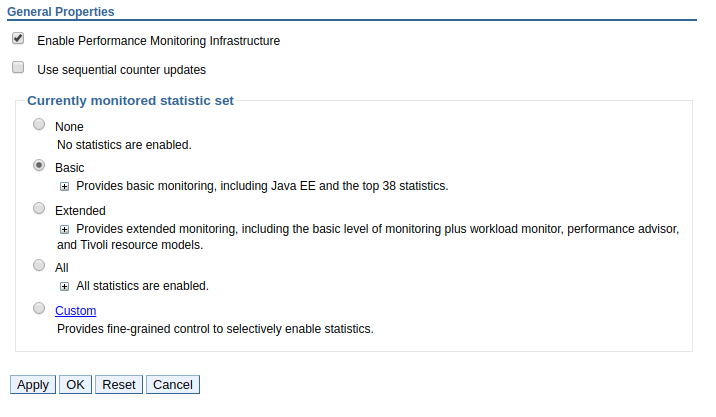
In the WebSphere admin console, expand Monitoring and Tuning and select Performance Monitoring Infrastructure (PMI). Select a node, server, or cluster. By default, PMI is enabled in Basic mode.
Some examples of the statistics that are monitored are the response time of servlets, the JDBC connections to a SQL database, and the amount of heap space being used. By default, the PMI data is held in memory for real time monitoring. It is also possible to store the data in a file for post mortem monitoring. WebSphere includes Tivoli Performance Viewer for real time monitoring. Tivoli Performance Viewer uses JMX (Java Management Extensions) to retrieve the PMI data. Or, you could use the Performance Servlet. The Performance Servlet uses HTTP to retrieve the PMI data.
Did you find this article helpful?
If so, consider buying me a coffee over at 