
Prometheus is a system used to
- Collect metrics (e.g. memory, CPU) - This is often referred to as "scraping metrics"
- Store the metrics, for example, in object storage, such as an Amazon Web Services S3 Bucket
- Configure conditions that should create an alert (e.g. high CPU or high memory usage)
For example, Prometheus can be used to gather metrics from servers, virtual machines (VMs), databases, containers (e.g. Docker, OpenShift), messaging (e.g. IBM MQ, RabbitMQ), and the list goes on. Then the metrics could be stored in object storage, such as an Amazon Web Services (AWS) S3 Bucket.
Often, an Observability system such as Kibana is used to display the metrics with a UI that is used to display query the metrics, for example, to find systems with high CPU or memory usage.
Also, an alerting system such as Alert Manager is often used to create alerts when a certain condition is met, such as a system with high CPU or high memory usage. The alerting system would route alerts to certain targets, such as an SMTP email server or OpsGenie.
Event "Prometheus has failed to evaluate rules in the last 5m" means that one of the Prometheus pods, which by default are in the openshift-monitoring namespace, could not evaluate one of it's rules. The kubectl get PrometheusRules (Kubernetes) or oc get PrometheusRules (OpenShift) command can be used to list the Prometheus Rules.
~]$ oc get PrometheusRules --namespace openshift-monitoring
NAME                                           AGE
alertmanager-main-rules                        692d
cluster-monitoring-operator-prometheus-rules   692d
kube-state-metrics-rules                       692d
kubernetes-monitoring-rules                    692d
node-exporter-rules                            692d
prometheus-k8s-prometheus-rules                692d
prometheus-k8s-thanos-sidecar-rules            692d
prometheus-operator-rules                      692d
telemetry                                      692d
thanos-querier                                 692d
Each Prometheus Rule will almost always contain multiple alerts. For example, if you view the YAML for a particular Prometheus Rule (alertmanager-main-rules in this example), the rule contains multiple alerts.
~]$ oc get PrometheusRule alertmanager-main-rules --namespace openshift-monitoring --output yaml
apiVersion: monitoring.coreos.com/v1
kind: PrometheusRule
metadata:
  creationTimestamp: "2023-07-07T15:43:12Z"
  generation: 2
  labels:
    app.kubernetes.io/component: alert-router
    app.kubernetes.io/instance: main
    app.kubernetes.io/managed-by: cluster-monitoring-operator
    app.kubernetes.io/name: alertmanager
    app.kubernetes.io/part-of: openshift-monitoring
    app.kubernetes.io/version: 0.26.0
    prometheus: k8s
    role: alert-rules
  name: alertmanager-main-rules
  namespace: openshift-monitoring
  resourceVersion: "433329758"
  uid: 1b98ab31-7439-4f52-9f48-c04a696979c3
spec:
  groups:
  - name: alertmanager.rules
    rules:
    - alert: AlertmanagerFailedReload
      annotations:
        description: Configuration has failed to load for {{ $labels.namespace }}/{{
          $labels.pod}}.
        runbook_url: https://github.com/openshift/runbooks/blob/master/alerts/cluster-monitoring-operator/AlertmanagerFailedReload.md
        summary: Reloading an Alertmanager configuration has failed.
      expr: |
        # Without max_over_time, failed scrapes could create false negatives, see
        # https://www.robustperception.io/alerting-on-gauges-in-prometheus-2-0 for details.
        max_over_time(alertmanager_config_last_reload_successful{job=~"alertmanager-main|alertmanager-user-workload"}[5m]) == 0
      for: 10m
      labels:
        severity: critical
    - alert: AlertmanagerMembersInconsistent
      annotations:
        description: Alertmanager {{ $labels.namespace }}/{{ $labels.pod}} has only
          found {{ $value }} members of the {{$labels.job}} cluster.
        summary: A member of an Alertmanager cluster has not found all other cluster
          members.
      expr: |
        # Without max_over_time, failed scrapes could create false negatives, see
        # https://www.robustperception.io/alerting-on-gauges-in-prometheus-2-0 for details.
          max_over_time(alertmanager_cluster_members{job=~"alertmanager-main|alertmanager-user-workload"}[5m])
        < on (namespace,service) group_left
          count by (namespace,service) (max_over_time(alertmanager_cluster_members{job=~"alertmanager-main|alertmanager-user-workload"}[5m]))
      for: 15m
      labels:
        severity: warning
    - alert: AlertmanagerFailedToSendAlerts
      annotations:
        description: Alertmanager {{ $labels.namespace }}/{{ $labels.pod}} failed
          to send {{ $value | humanizePercentage }} of notifications to {{ $labels.integration
          }}.
        runbook_url: https://github.com/openshift/runbooks/blob/master/alerts/cluster-monitoring-operator/AlertmanagerFailedToSendAlerts.md
        summary: An Alertmanager instance failed to send notifications.
      expr: |
        (
          rate(alertmanager_notifications_failed_total{job=~"alertmanager-main|alertmanager-user-workload"}[5m])
        /
          ignoring (reason) group_left rate(alertmanager_notifications_total{job=~"alertmanager-main|alertmanager-user-workload"}[5m])
        )
        > 0.01
      for: 5m
      labels:
        severity: warning
    - alert: AlertmanagerClusterFailedToSendAlerts
      annotations:
        description: The minimum notification failure rate to {{ $labels.integration
          }} sent from any instance in the {{$labels.job}} cluster is {{ $value |
          humanizePercentage }}.
        runbook_url: https://github.com/openshift/runbooks/blob/master/alerts/cluster-monitoring-operator/AlertmanagerClusterFailedToSendAlerts.md
        summary: All Alertmanager instances in a cluster failed to send notifications
          to a critical integration.
      expr: |
        min by (namespace,service, integration) (
          rate(alertmanager_notifications_failed_total{job=~"alertmanager-main|alertmanager-user-workload", integration=~`.*`}[5m])
        /
          ignoring (reason) group_left rate(alertmanager_notifications_total{job=~"alertmanager-main|alertmanager-user-workload", integration=~`.*`}[5m])
        )
        > 0.01
      for: 5m
      labels:
        severity: warning
    - alert: AlertmanagerConfigInconsistent
      annotations:
        description: Alertmanager instances within the {{$labels.job}} cluster have
          different configurations.
        summary: Alertmanager instances within the same cluster have different configurations.
      expr: |
        count by (namespace,service) (
          count_values by (namespace,service) ("config_hash", alertmanager_config_hash{job=~"alertmanager-main|alertmanager-user-workload"})
        )
        != 1
      for: 20m
      labels:
        severity: warning
    - alert: AlertmanagerClusterDown
      annotations:
        description: '{{ $value | humanizePercentage }} of Alertmanager instances
          within the {{$labels.job}} cluster have been up for less than half of the
          last 5m.'
        summary: Half or more of the Alertmanager instances within the same cluster
          are down.
      expr: |
        (
          count by (namespace,service) (
            avg_over_time(up{job=~"alertmanager-main|alertmanager-user-workload"}[5m]) < 0.5
          )
        /
          count by (namespace,service) (
            up{job=~"alertmanager-main|alertmanager-user-workload"}
          )
        )
        >= 0.5
      for: 5m
      labels:
        severity: warning
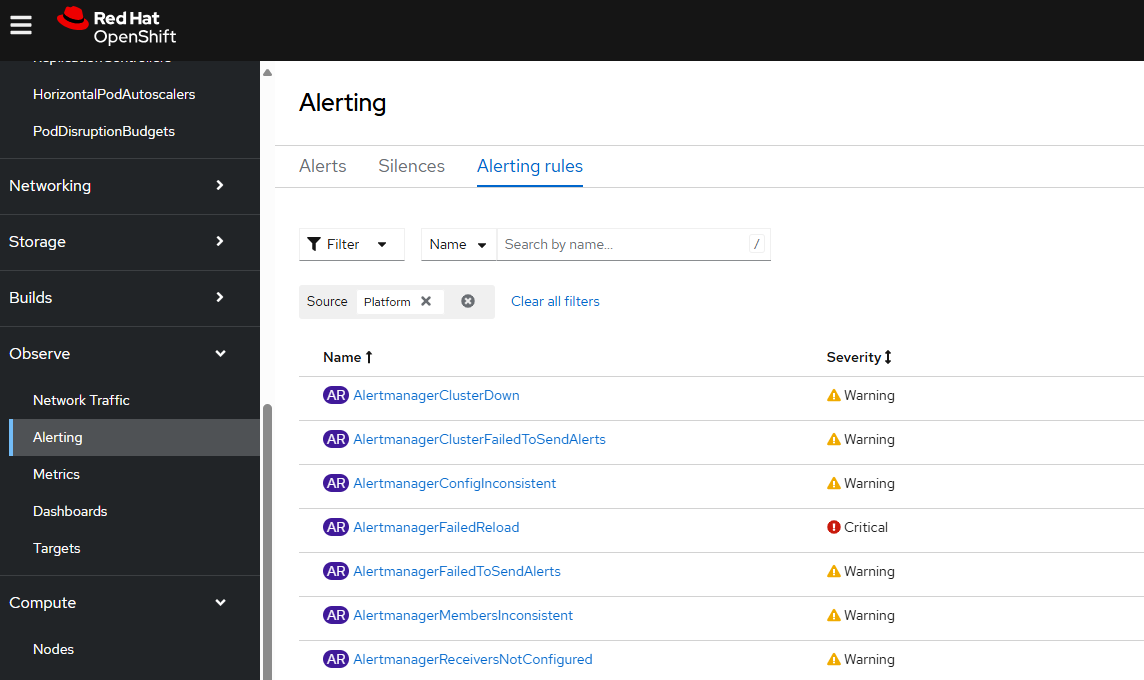
Or in the OpenShift console, at Observe > Alerting > Alerting rules the alerts in each Prometheus Rule will be listed.
The kubectl get pods (Kubernetes) or oc get pods (OpenShift) command can be used to list the Prometheus pods.
~]$ oc get pods --namespace openshift-monitoring | grep -i prometheus
prometheus-adapter-8559d6b5fb-42mng            1/1     Running   0          13h
prometheus-adapter-8559d6b5fb-ppcxf            1/1     Running   0          13h
prometheus-k8s-0                               6/6     Running   1          67d
prometheus-k8s-1                               6/6     Running   1          67d
prometheus-operator-5956c5d77-84qzq            2/2     Running   0          68d
The kubectl logs (Kubernetes) or oc logs (OpenShift) command can be used to look for interesting events with the Prometheus pods.
~]$ oc logs pod/prometheus-k8s-0 --namespace openshift-monitoring --container prometheus
Here is one such interesting event. Notice the event has "timed out". This may be related to this Red Hat Bugzilla, which indicates the rule has been removed starting with version 4.6.9 of OpenShift.
~]$ oc logs pod/prometheus-k8s-0 --namespace openshift-monitoring
level=warn ts=2021-09-14T09:20:29.235Z caller=manager.go:598 component="rule manager" group=kube-apiserver-availability.rules msg="Evaluating rule failed" rule="record: apiserver_request:availability30d\nexpr: 1 - ((sum(increase(apiserver_request_duration_seconds_count{verb=~\"POST|PUT|PATCH|DELETE\"}[30d])) - sum(increase(apiserver_request_duration_seconds_bucket{le=\"1\",verb=~\"POST|PUT|PATCH|DELETE\"}[30d]))) + (sum(increase(apiserver_request_duration_seconds_count{verb=~\"LIST|GET\"}[30d])) - ((sum(increase(apiserver_request_duration_seconds_bucket{le=\"0.1\",scope=~\"resource|\",verb=~\"LIST|GET\"}[30d])) or vector(0)) + sum(increase(apiserver_request_duration_seconds_bucket{le=\"0.5\",scope=\"namespace\",verb=~\"LIST|GET\"}[30d])) + sum(increase(apiserver_request_duration_seconds_bucket{le=\"5\",scope=\"cluster\",verb=~\"LIST|GET\"}[30d])))) + sum(code:apiserver_request_total:increase30d{code=~\"5..\"} or vector(0))) / sum(code:apiserver_request_total:increase30d)\nlabels:\n verb: all\n" err="query timed out in expression evaluation"
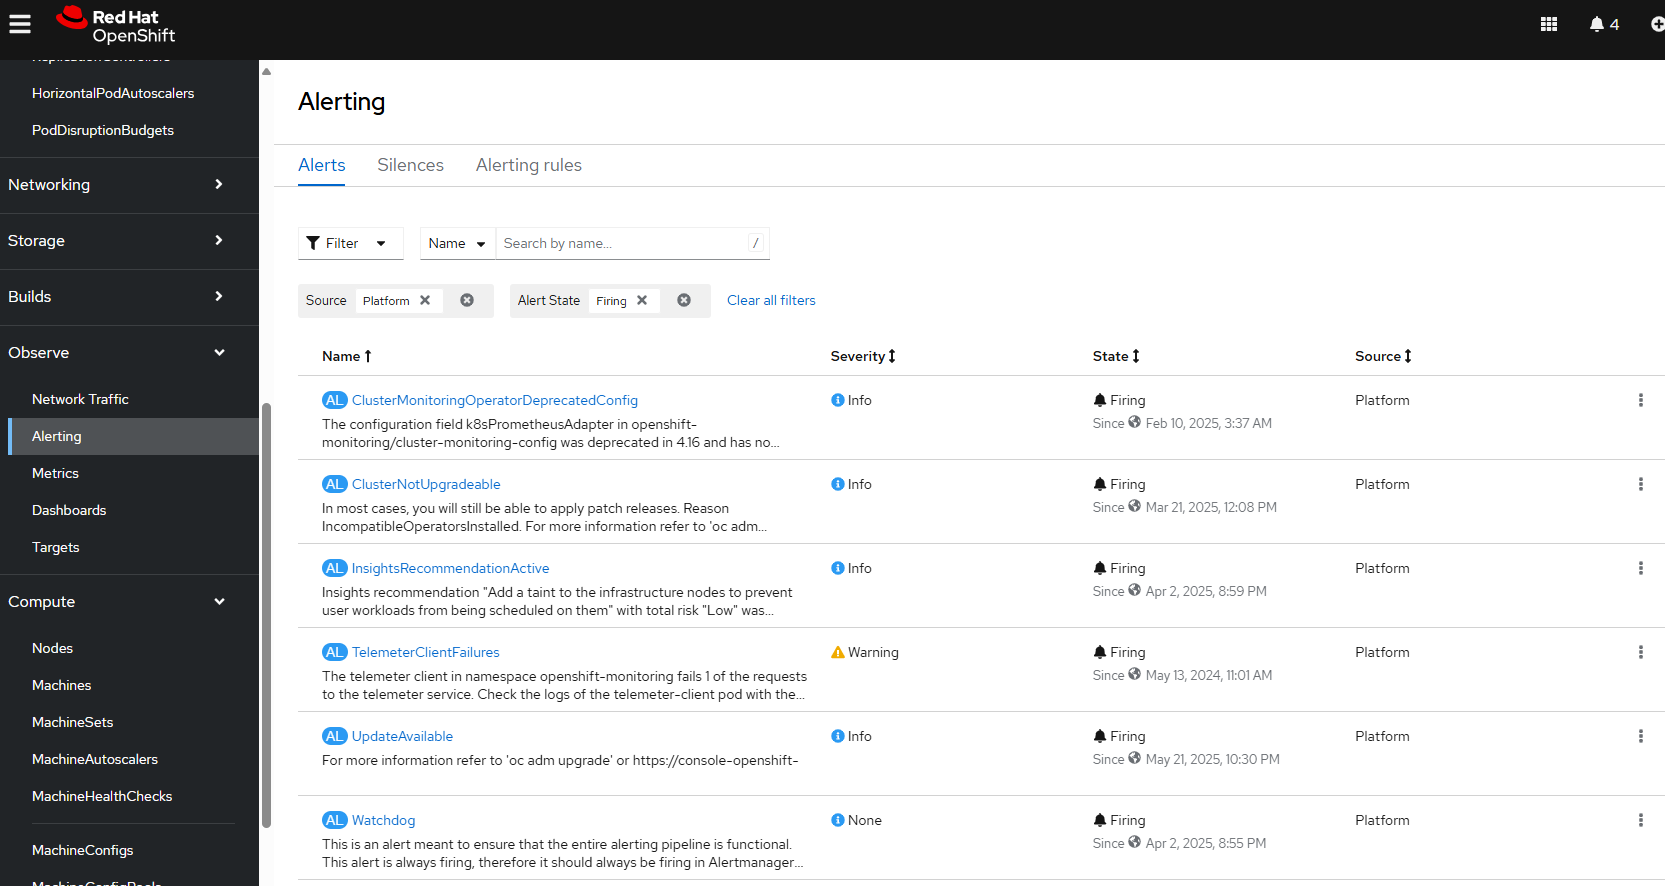
Or in the OpenShift console, at Observe > Alerting the active, firing alerts will be listed.
Did you find this article helpful?
If so, consider buying me a coffee over at 