
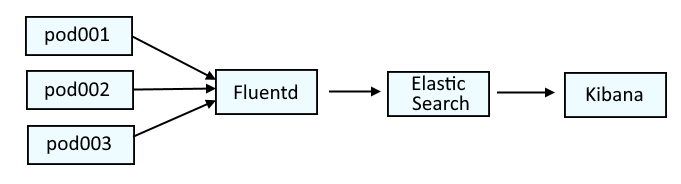
This diagram illustrates the systems that are typically used to parse log data on OpenShift. Fluentd collects the log data from the containers and passes the log data onto Elastic Search. Optionally, Kibana can be used as a tool that may make it easier to visualize the logs.
This is similar to the ELK stack (Elastic Search, Logstash, Kibana), but would actually be the EFK stack (Elastic Search, Fluentd, Kibana).
If you are not familiar with the oc command, refer to OpenShift - Getting Started with the oc command.
The es_util command or cURL can be used to do something in an Elastic Search pod.
The oc get pods command can be used to list the Elastic Search pods in the openshift-logging project.
~]$ oc get pods --namespace openshift-logging
NAME                                            READY   STATUS      RESTARTS   AGE
elasticsearch-cdm-11c6ubcb-1-6888c6fcb9-frlxz   2/2     Running     0          5d5h
elasticsearch-cdm-11c6ubcb-2-6bddf77998-9m28k   2/2     Running     0          5d4h
elasticsearch-cdm-11c6ubcb-3-5955f88f5-mm9c2    2/2     Running     0          5d4h
elasticsearch-im-app-28342275-dkg7m             0/1     Completed   0          4m38s
elasticsearch-im-audit-28342275-nldkt           0/1     Completed   0          4m38s
elasticsearch-im-infra-28342275-b624d           0/1     Completed   0          4m38s
The oc exec and es_util commands can be used to display the cluster settings.
~]$ oc exec elasticsearch-cdm-11c6ubcb-1-6888c6fcb9-frlxz --container elasticsearch --namespace openshift-logging -- es_util --query=_cat/_cluster/settings?pretty
{
  "persistent" : {
    "cluster" : {
      "routing" : {
        "allocation" : {
          "enable" : "all"
        }
      }
    },
    "discovery" : {
      "zen" : {
        "minimum_master_nodes" : "2"
      }
    }
  },
  "transient" : { }
}
Or like this, using curl.
oc exec elasticsearch-cdm-mrpf7eom-3-566bd5f5cb-lkdz9 --container elasticsearch --namespace openshift-logging -- curl -tls1.2 --silent --insecure --cert /etc/elasticsearch/secret/admin-cert --key /etc/elasticsearch/secret/admin-key --request GET --url https://localhost:9200/_cat/_cluster/settings?pretty
Did you find this article helpful?
If so, consider buying me a coffee over at 