
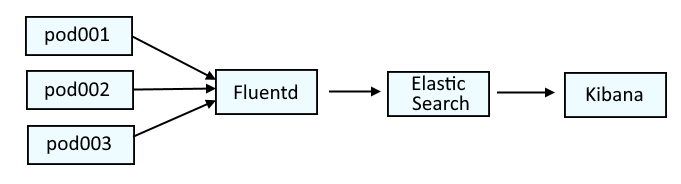
This diagram illustrates the systems that are typically used to parse log data on OpenShift. Fluentd collects the log data from the containers and passes the log data onto Elastic Search. Optionally, Kibana can be used as a tool that may make it easier to visualize the logs.
This is similar to the ELK stack (Elastic Search, Logstash, Kibana), but would actually be the EFK stack (Elastic Search, Fluentd, Kibana).
If you are not familiar with the oc command, refer to OpenShift - Getting Started with the oc command.
The es_util command or cURL can be used to do something in an Elastic Search pod
The oc get pods command can be used to list the Elastic Search pods in the openshift-logging project.
~]$ oc get pods --namespace openshift-logging
NAME                                            READY   STATUS      RESTARTS   AGE
elasticsearch-cdm-11c6ubcb-1-6888c6fcb9-frlxz   2/2     Running     0          5d5h
elasticsearch-cdm-11c6ubcb-2-6bddf77998-9m28k   2/2     Running     0          5d4h
elasticsearch-cdm-11c6ubcb-3-5955f88f5-mm9c2    2/2     Running     0          5d4h
elasticsearch-im-app-28342275-dkg7m             0/1     Completed   0          4m38s
elasticsearch-im-audit-28342275-nldkt           0/1     Completed   0          4m38s
elasticsearch-im-infra-28342275-b624d           0/1     Completed   0          4m38s
The oc exec and es_util commands can be used to list the Elastic Search Indices.
- v=true includes the column headers
- s=index sorts the output on the index column
AVOID TROUBLE
Make sure to wrap --query in single or double quotes
oc exec elasticsearch-cdm-mrpf7eom-3-566bd5f5cb-lkdz9 --container elasticsearch --namespace openshift-logging -- es_util --query="_cat/indices?v=true&s=index"
Or like this, using curl.
oc exec elasticsearch-cdm-11c6ubcb-1-6888c6fcb9-frlxz --container elasticsearch --namespace openshift-logging -- curl -tls1.2 --silent --insecure --cert /etc/elasticsearch/secret/admin-cert --key /etc/elasticsearch/secret/admin-key https://localhost:9200/_cat/indices?v=true&s=index
Something like this should be returned. Notice this includes docs.count, the number of documents in each indice.
health status index                             uuid                   pri rep docs.count docs.deleted store.size pri.store.size
green  open   .kibana_1                         yWqI104cS9-xUnjZKOoq5A   1   1          1            0      7.7kb          3.8kb
green  open   .kibana_1355826620_clusteradmin_1 kSndd4NFRE6VMcPGsL-mQQ   1   1          1            0      7.4kb          3.7kb
green  open   .kibana_1933325657_johndoe_1      I8KdZUWxT7uGOr66h54r1g   1   1          1            0      7.4kb          3.7kb
green  open   .kibana_1933326582_janedoe_1      6bAstQaKRdGMm1Oku0cTXg   1   1          1            0      7.4kb          3.7kb
green  open   .security                         yQpaTn4PS1aiH1TCnbetIg   1   1          6            0       40kb           20kb
yellow open   app-005316                        uQ7oQRrUQWeW98-2k_pGig   3   1     229533            0    180.6mb        180.6mb
yellow open   app-005317                        -TlcgrcXQJ6H0c6lxDEUrQ   3   1     354241            0    264.4mb        264.4mb
yellow open   app-005318                        ct1A4b7QS5iFDdKkBl53Ng   3   1     161985            0    131.1mb        131.1mb
yellow open   app-005319                        NpYf1mVhTr6KJ38PKDqxlw   3   1     325033            0      226mb          226mb
yellow open   app-005320                        Dl522cpDTM2nDdzV71L5Ww   3   1     196181            0    133.8mb        133.8mb
yellow open   app-005321                        Qr6wIWJSQKOBQFClyecTsQ   3   1     227706            0    171.7mb        171.7mb
yellow open   app-005322                        vpnUWoPqQqyA7GaL6vJHsw   3   1     372373            0    247.6mb        247.6mb
red    open   app-005323                        tH8ASWxqRbia0oGg6EZcRA   3   1
yellow open   audit-008447                      eKR1N2fqSg-g9aj8qpd8tw   3   1          0            0       783b           783b
yellow open   audit-008448                      tnY1oaCPQWC0x3e2p-ZrKw   3   1          0            0       783b           783b
yellow open   audit-008449                      yC7MAkElQWqc26cfXPb01w   3   1          0            0       783b           783b
yellow open   audit-008450                      1e-0nL75RI-c4HJySQcFWw   3   1          0            0       783b           783b
yellow open   audit-008451                      vXzUXyqsQWKYGLhlXoZ0lQ   3   1          0            0       783b           783b
yellow open   audit-008452                      flXMHxhZSVq_qEvabV9nMg   3   1          0            0       783b           783b
yellow open   audit-008453                      aq0GCCaCTRmr_kCHm3TwCw   3   1          0            0       783b           783b
red    open   audit-008454                      z6S8C4DfTyuAFHB3yAk79w   3   1
green  open   infra-008217                      XhZYBoiPTAq7lgHG48ZEgA   3   1    1019141            0      3.8gb          1.9gb
green  open   infra-008218                      WpAJs6UmRYiosf28rsb8mQ   3   1    1217333            0      4.4gb          2.2gb
green  open   infra-008219                      GITA_8UAStioE0P12mXWBA   3   1     994060            0      3.7gb          1.8gb
green  open   infra-008220                      Q-AAhsOZQhS-tSZPpqzmfQ   3   1    1226890            0      4.5gb          2.2gb
green  open   infra-008221                      KJi77rcJT_OXwejEkEYJqg   3   1  132719080            0      472gb        236.6gb
Here is how you can list the 10 most recent documents in an indice, replacing <index> with the index in the prior output.
oc exec elasticsearch-cdm-mrpf7eom-3-566bd5f5cb-lkdz9 --container elasticsearch --namespace openshift-logging -- es_util --query="<index>/_search"
For example.
oc exec elasticsearch-cdm-mrpf7eom-3-566bd5f5cb-lkdz9 --container elasticsearch --namespace openshift-logging -- es_util --query="infra-008221/_search"
size can be used to specify the number of documents you would like returned.
oc exec elasticsearch-cdm-mrpf7eom-3-566bd5f5cb-lkdz9 --container elasticsearch --namespace openshift-logging -- es_util --query="infra-008221/_search?size=100"
And here is some boilerplate Python that can be used to loop through each result.
#!/usr/bin/python3
import json
import subprocess

command = "oc exec elasticsearch-cdm-mrpf7eom-3-566bd5f5cb-lkdz9 --container elasticsearch --namespace openshift-logging -- es_util --query='infra-008221/_search'"

stdout,stderr = subprocess.Popen(command, shell=True, stdout=subprocess.PIPE, stderr=subprocess.PIPE).communicate()

parsed_json = json.loads(stdout.decode('utf-8'))

for line in parsed_json['hits']['hits']:
  print(line)
  print('')
Did you find this article helpful?
If so, consider buying me a coffee over at 