
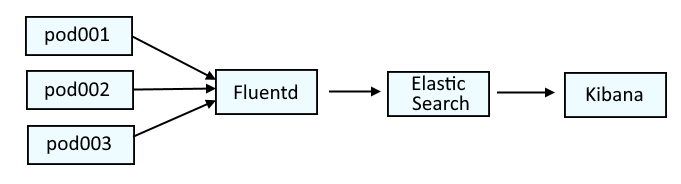
This diagram illustrates the systems that are typically used to parse log data on OpenShift. Fluentd collects the log data from the containers and passes the log data onto Elastic Search. Optionally, Kibana can be used as a tool that may make it easier to visualize the logs.
This is similar to the ELK stack (Elastic Search, Logstash, Kibana), but would actually be the EFK stack (Elastic Search, Fluentd, Kibana).
If you are not familiar with the oc command, refer to OpenShift - Getting Started with the oc command.
Almost always, Elastic Search is in the openshift-logging project. The following command can be used to return the health of Elastic Search.
- green = all good
- yellow = warning
- red = somethings pretty hosed up
~]$ oc get elasticsearch --namespace openshift-logging
NAME            MANAGEMENT STATE   HEALTH   NODES   DATA NODES   SHARD ALLOCATION   INDEX MANAGEMENT
elasticsearch   Managed            yellow   3       3            all
Or, the oc get pods command can be used to list the Elastic Search pods in the openshift-logging project.
~]$ oc get pods --namespace openshift-logging
NAME                                            READY   STATUS      RESTARTS   AGE
elasticsearch-cdm-11c6ubcb-1-6888c6fcb9-frlxz   2/2     Running     0          5d5h
elasticsearch-cdm-11c6ubcb-2-6bddf77998-9m28k   2/2     Running     0          5d4h
elasticsearch-cdm-11c6ubcb-3-5955f88f5-mm9c2    2/2     Running     0          5d4h
elasticsearch-im-app-28342275-dkg7m             0/1     Completed   0          4m38s
elasticsearch-im-audit-28342275-nldkt           0/1     Completed   0          4m38s
elasticsearch-im-infra-28342275-b624d           0/1     Completed   0          4m38s
And then the oc exec command can be used in one of the elasticsearch-cdm pods to run the health command.
oc exec elasticsearch-cdm-mrpf7eom-3-566bd5f5cb-lkdz9 --container elasticsearch --namespace openshift-logging -- health
Something like this should be returned.
epoch      timestamp cluster       status node.total node.data shards pri relo init unassign pending_tasks max_task_wait_time active_shards_percent
1700541655 04:40:55  elasticsearch yellow          3         3   1056 529    0    0        2             0                  -                 99.8%
Often, the health will be yellow or red when
- The percentage of disk space being used by Elastic Search has exceeded the disk watermark threshold, which is typically 85%, meaning that 85% of the available disk space is being used, which then leads to shards being unable to be assigned to a node (unassigned shards) and also leads to indices then being yellow or red.
- cluster.routing.allocation.enabled is set to primaries, new_primaries or none instead of all which may cause same_shard and "the shard cannot be allocated to the same node on which a copy of the shard already exists"
The oc exec command can be use the run the es_util command in one of the elasticsearch-cdm pods. Often, this will return the reason why Elastic Search is yellow or red.
AVOID TROUBLE
Make sure to wrap --query in single or double quotes
~]$ oc exec elasticsearch-cdm-11c6ubcb-1-6888c6fcb9-frlxz --container elasticsearch --namespace openshift-logging -- es_util --query="_cluster/allocation/explain?pretty"
{
  "index" : "app-005586",
  "shard" : 1,
  "primary" : false,
  "current_state" : "unassigned",
  "unassigned_info" : {
    "reason" : "INDEX_CREATED",
    "at" : "2024-05-07T09:45:04.236Z",
    "last_allocation_status" : "no_attempt"
  },
  "can_allocate" : "no",
  "allocate_explanation" : "cannot allocate because allocation is not permitted to any of the nodes",
  "node_allocation_decisions" : [
    {
      "node_id" : "zZDAC6tURe6RnWbKOxqhpg",
      "node_name" : "elasticsearch-cdm-nc0yql38-3",
      "transport_address" : "10.130.8.6:9300",
      "node_decision" : "no",
      "weight_ranking" : 1,
      "deciders" : [
        {
          "decider" : "enable",
          "decision" : "NO",
          "explanation" : "replica allocations are forbidden due to cluster setting [cluster.routing.allocation.enable=primaries]"
        }
      ]
    },
    {
      "node_id" : "hTauU8PASjCAaJ8f84rAUg",
      "node_name" : "elasticsearch-cdm-nc0yql38-2",
      "transport_address" : "10.131.8.149:9300",
      "node_decision" : "no",
      "weight_ranking" : 2,
      "deciders" : [
        {
          "decider" : "enable",
          "decision" : "NO",
          "explanation" : "replica allocations are forbidden due to cluster setting [cluster.routing.allocation.enable=primaries]"
        },
        {
          "decider" : "same_shard",
          "decision" : "NO",
          "explanation" : "the shard cannot be allocated to the same node on which a copy of the shard already exists [[app-005586][1], node[hTauU8PASjCAaJ8f84rAUg], [P], s[STARTED], a[id=M0prYVhcQ7aU0dORpThp5g]]"
        }
      ]
    },
    {
      "node_id" : "ZtWHX-icSYaXS8N_YC-ntg",
      "node_name" : "elasticsearch-cdm-nc0yql38-1",
      "transport_address" : "10.128.10.126:9300",
      "node_decision" : "no",
      "weight_ranking" : 3,
      "deciders" : [
        {
          "decider" : "enable",
          "decision" : "NO",
          "explanation" : "replica allocations are forbidden due to cluster setting [cluster.routing.allocation.enable=primaries]"
        }
      ]
    }
  ]
}
Notice in this example that SHARD ALLOCATION is primaries.
]$ oc get elasticsearch --namespace openshift-logging
NAME            MANAGEMENT STATE   HEALTH   NODES   DATA NODES   SHARD ALLOCATION   INDEX MANAGEMENT
elasticsearch   Managed            yellow   3       3            primaries
And half of the shards are unassigned.
]$ oc exec elasticsearch-cdm-11c6ubcb-1-6888c6fcb9-frlxz --container elasticsearch --namespace openshift-logging -- health
Wed May  8 09:15:17 UTC 2024
epoch      timestamp cluster       status node.total node.data shards pri relo init unassign pending_tasks max_task_wait_time active_shards_percent
1715159717 09:15:17  elasticsearch yellow          3         3    251 251    0    0      251             0                  -                 50.0%
More details on the unassigned shards.
]$ oc exec elasticsearch-cdm-11c6ubcb-1-6888c6fcb9-frlxz --container elasticsearch --namespace openshift-logging -- es_util --query="_cat/allocation?v=true"
shards disk.indices disk.used disk.avail disk.total disk.percent host          ip            node
    84        8.4gb    15.6gb    167.3gb      183gb            8 10.128.10.126 10.128.10.126 elasticsearch-cdm-nc0yql38-1
    83       11.5gb      28gb    154.9gb      183gb           15 10.130.8.6    10.130.8.6    elasticsearch-cdm-nc0yql38-3
    84        7.5gb    14.6gb    168.3gb      183gb            8 10.131.8.149  10.131.8.149  elasticsearch-cdm-nc0yql38-2
   251                                                                                       UNASSIGNED
You may want to update the SHARD ALLOCATION to "all".
oc exec elasticsearch-cdm-11c6ubcb-1-6888c6fcb9-frlxz --container elasticsearch --namespace openshift-logging -- es_util --query="_cluster/settings" --request PUT --data '{ "persistent": { "cluster.routing.allocation.enable" : "all" } }'
Did you find this article helpful?
If so, consider buying me a coffee over at 