
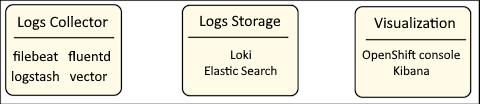
Logging in OpenShift is separated into different systems and services that serve a specific purpose.
- Collecting log data - typically done with filebeat, fluentd, logstash or vector
- Storing log data, for example, in an Amazon Web Services (AWS) S3 Bucket - typically done with Loki or Elastic Search
- Visualizing and query log data - typically done in the OpenShift console or in Kibana
There are abbreviations used as shorthand for the collection of systems and services to collect, store and visualize log data.
- EFK (Elastic Search, Fluentd, Kibana)
- ELK (Elastic Search, Logstash, Kibana)
- EVK (Elastic Search, Vector, Kibana)
- LFK (Loki, Fluentd, Kibana)
- LLK (Loki, Logstash, Kibana)
- LVK (Loki, Vector, Kibana)
The first step in configuring OpenShift to collect log data from various different types of resources in your OpenShift cluster, such as nodes, pods, and so on is to install an Operator that will collect the log data. This is often done by installing the Cluster Logging Operator. Check out my article OpenShift - Getting Started with Cluster Logging.
There are a few different commands that can be used to view logs.
- oc logs command can be used to view for a particular resource, such as a pod, a service, a replica set, and so on (this article)
- If you've deployed Event Router to collect Kubernetes events/logs, the oc logs command (this article) can be used to view the Kubernetes logs in the eventrouter pod
- oc node-logs command can be used to view node logs
The oc get pods command can be used to list the pods in the currently selected project.
~]# oc get pods
NAME         READY   STATUS     RESTARTS  AGE
foo-9mzm2    1/1     Running    0         8d
foo-vmzmz    1/1     Running    0         8d
bar-pflxc    1/1     Running    0         8d
The oc logs pod/<pod name> command can be used to view a pods log.
oc logs pod/foo-9mzm2
The output can be pipe to the tail command to only view the last 10 entries in the log.
oc logs pod/foo-9mzm2 | tail
The -f or --follow option can be used to stream the log in real time.
oc logs -f pod/foo-9mzm2
The -p or --previous flag can be used to see the previous log. For example, if a pod has restarted, perhaps because it is crash looping, you can view the prior log before the pod was restarted.
oc logs -p pod/foo-9mzm2
The -s or --since option can be used to only display logs in the last x seconds, x mintues, or x days.
oc logs -p pod/foo-9mzm2 --since=24h
Or, you could SSH onto node server1.example.com. Switch to the root user account.
sudo -i
The container will contain the POD log, like this.
ll /var/lib/docker/containers/9db83c50f717fd4a42e98397aa8bc05442c6794bbe7e76337bb601f6d6197d1d


-rw-r-----. 1 root root 233245 Jul 22 15:23 9db83c50f717fd4a42e98397aa8bc05442c6794bbe7e76337bb601f6d6197d1d-json.log
drwx------. 2 root root      6 Jul 21 17:20 checkpoints
-rw-r--r--. 1 root root  12137 Jul 21 17:20 config.v2.json
-rw-r--r--. 1 root root   2668 Jul 21 17:20 hostconfig.json
drwxr-xr-x. 8 root root    220 Jul 21 17:20 secrets
Did you find this article helpful?
If so, consider buying me a coffee over at 