
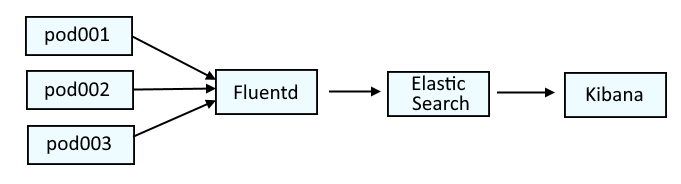
This diagram illustrates the systems that are typically used to parse log data on OpenShift. Fluentd collects the log data from the containers and passes the log data onto Elastic Search. Optionally, Kibana can be used as a tool that may make it easier to visualize the logs.
This is similar to the ELK stack (Elastic Search, Logstash, Kibana), but would actually be the EFK stack (Elastic Search, Fluentd, Kibana).
If you are not familiar with the oc command, refer to OpenShift - Getting Started with the oc command.
Almost always, Elastic Search is in the openshift-logging project. The following command can be used to return the health of Elastic Search.
- green = all good
- yellow = warning
- red = somethings pretty hosed up
~]$ oc get elasticsearch --namespace openshift-logging
NAME            MANAGEMENT STATE   HEALTH   NODES   DATA NODES   SHARD ALLOCATION   INDEX MANAGEMENT
elasticsearch   Managed            yellow   3       3            all
Or, the oc get pods command can be used to list the Elastic Search pods in the openshift-logging project.
~]$ oc get pods --namespace openshift-logging
NAME                                            READY   STATUS      RESTARTS   AGE
elasticsearch-cdm-11c6ubcb-1-6888c6fcb9-frlxz   2/2     Running     0          5d5h
elasticsearch-cdm-11c6ubcb-2-6bddf77998-9m28k   2/2     Running     0          5d4h
elasticsearch-cdm-11c6ubcb-3-5955f88f5-mm9c2    2/2     Running     0          5d4h
elasticsearch-im-app-28342275-dkg7m             0/1     Completed   0          4m38s
elasticsearch-im-audit-28342275-nldkt           0/1     Completed   0          4m38s
elasticsearch-im-infra-28342275-b624d           0/1     Completed   0          4m38s
And then the oc exec command can be used in one of the elasticsearch-cdm pods to run the health command.
oc exec elasticsearch-cdm-mrpf7eom-3-566bd5f5cb-lkdz9 --container elasticsearch --namespace openshift-logging -- health
Something like this should be returned.
epoch      timestamp cluster       status node.total node.data shards pri relo init unassign pending_tasks max_task_wait_time active_shards_percent
1700541655 04:40:55  elasticsearch yellow          3         3   1056 529    0    0        2             0                  -                 99.8%
Often, the health will be yellow or red when
- The percentage of disk space being used by Elastic Search has exceeded the disk watermark threshold, which is typically 85%, meaning that 85% of the available disk space is being used, which then leads to shards being unable to be assigned to a node (unassigned shards) and also leads to indices then being yellow or red.
- cluster.routing.allocation.enabled is set to primaries, new_primaries or none instead of all which may cause same_shard and "the shard cannot be allocated to the same node on which a copy of the shard already exists"
The oc exec command can be use the run the es_util command in one of the elasticsearch-cdm pods. Often, this will return the reason why Elastic Search is yellow or red.
AVOID TROUBLE
Make sure to wrap --query in single or double quotes
~]$ oc exec elasticsearch-cdm-11c6ubcb-1-6888c6fcb9-frlxz --container elasticsearch --namespace openshift-logging -- es_util --query="_cluster/allocation/explain?pretty"
{
  "index" : "app-019996",
  "shard" : 1,
  "primary" : false,
  "current_state" : "unassigned",
  "unassigned_info" : {
    "reason" : "INDEX_CREATED",
    "at" : "2023-11-21T04:45:05.399Z",
    "last_allocation_status" : "no_attempt"
  },
  "can_allocate" : "no",
  "allocate_explanation" : "cannot allocate because allocation is not permitted to any of the nodes",
  "node_allocation_decisions" : [
    {
      "node_id" : "Yg84vLgMTQy5uZlxuXJDuQ",
      "node_name" : "elasticsearch-cdm-11c6ubcb-1",
      "transport_address" : "10.129.6.157:9300",
      "node_decision" : "no",
      "weight_ranking" : 1,
      "deciders" : [
        {
          "decider" : "disk_threshold",
          "decision" : "NO",
          "explanation" : "the node is above the low watermark cluster setting [cluster.routing.allocation.disk.watermark.low=85%], using more disk space than the maximum allowed [85.0%], actual free: [10.542218124998866%]"
        }
      ]
    },
    {
      "node_id" : "JyErv2KCQUO3hRrmqY7EeA",
      "node_name" : "elasticsearch-cdm-11c6ubcb-2",
      "transport_address" : "10.130.4.248:9300",
      "node_decision" : "no",
      "weight_ranking" : 2,
      "deciders" : [
        {
          "decider" : "same_shard",
          "decision" : "NO",
          "explanation" : "the shard cannot be allocated to the same node on which a copy of the shard already exists [[app-019996][1], node[JyErv2KCQUO3hRrmqY7EeA], [P], s[STARTED], a[id=_f2Y4pc4SJ2wfuqaEDosWA]]"
        },
        {
          "decider" : "disk_threshold",
          "decision" : "NO",
          "explanation" : "the node is above the low watermark cluster setting [cluster.routing.allocation.disk.watermark.low=85%], using more disk space than the maximum allowed [85.0%], actual free: [10.760874016856427%]"
        }
      ]
    },
    {
      "node_id" : "A2oUJ9LNRsO1C-NV1xOVdg",
      "node_name" : "elasticsearch-cdm-11c6ubcb-3",
      "transport_address" : "10.128.7.132:9300",
      "node_decision" : "no",
      "weight_ranking" : 3,
      "deciders" : [
        {
          "decider" : "disk_threshold",
          "decision" : "NO",
          "explanation" : "the node is above the low watermark cluster setting [cluster.routing.allocation.disk.watermark.low=85%], using more disk space than the maximum allowed [85.0%], actual free: [9.577802163517253%]"
        }
      ]
    }
  ]
}
If the disk watermark has been reached, I always then check to see if the crontab job running the bash delete-then-rollover script was missed too many times. The oc get crontjobs command can be used to list the Elastic Search cronjobs. Notice in this example that cronjob elasticsearch-im-infra has ACTIVE 1. This suggests the cronjob is NOT active.
~]$ oc get cronjobs --namespace openshift-logging
NAME                     SCHEDULE       SUSPEND   ACTIVE   LAST SCHEDULE   AGE
elasticsearch-im-app     */15 * * * *   False     0        11m             677d
elasticsearch-im-audit   */15 * * * *   False     0        11m             677d
elasticsearch-im-infra   */15 * * * *   False     1        13d             677d
The oc describe cronjob command can be used to see if any of the cronjobs have TooManyMissedTimes. Likewise, the oc get events command may also return 'TooManyMissedTimes' and/or 'too many missed start times'.
~]$ oc describe cronjob elasticsearch-im-infra --namespace openshift-logging
Events:
  Type     Reason              Age                     From                Message
  ----     ------              ----                    ----                -------
  Normal   JobAlreadyActive    14m (x3298 over 13d)    cronjob-controller  Not starting job because prior execution is running and concurrency policy is Forbid
  Warning  TooManyMissedTimes  4m37s (x3050 over 12d)  cronjob-controller  too many missed start times. Set or decrease .spec.startingDeadlineSeconds or check clock skew
If there are 'TooManyMissedTimes' and/or 'too many missed start times', I then next check to see if there are old jobs. Notice in this example that there are 3 elasticsearch-im-infra jobs that are 13 days old.
]$ oc get jobs --namespace openshift-logging
NAME                                      COMPLETIONS   DURATION   AGE
elasticsearch-im-app-28566705             1/1           37s        4h58m
elasticsearch-im-app-28566990             0/1           13m        13m
elasticsearch-im-audit-28566705           1/1           38s        4h58m
elasticsearch-im-audit-28566990           0/1           13m        13m
elasticsearch-im-infra-28546965           0/1           13d        13d
elasticsearch-im-infra-28547025           1/1           19s        13d
elasticsearch-im-infra-28547040           0/1           13d        13d
osd-delete-ownerrefs-bz1906584-27576007   1/1           5s         688d
osd-delete-ownerrefs-bz1906584-27576037   1/1           7s         688d
osd-delete-ownerrefs-bz1906584-27576067   1/1           7s         688d
I deleted the old jobs.
oc delete job elasticsearch-im-infra-28546965 --namespace openshfit-logging
oc delete job elasticsearch-im-infra-28547025 --namespace openshfit-logging
oc delete job elasticsearch-im-infra-28547040 --namespace openshfit-logging
And then wait a few moments and recheck the crontab job. Hooray, its is no longer ACTIVE 1.
~]$ oc get cronjobs --namespace openshift-logging
NAME                     SCHEDULE       SUSPEND   ACTIVE   LAST SCHEDULE   AGE
elasticsearch-im-app     */15 * * * *   False     0        8m4s            677d
elasticsearch-im-audit   */15 * * * *   False     0        8m4s            677d
elasticsearch-im-infra   */15 * * * *   False     0        8m4s            677d
And a new job was spawned.
]$ oc get jobs --namespace openshift-logging
NAME                                      COMPLETIONS   DURATION   AGE
elasticsearch-im-app-28566705             1/1           37s        5h8m
elasticsearch-im-app-28567005             0/1           8m24s      8m24s
elasticsearch-im-audit-28566705           1/1           38s        5h8m
elasticsearch-im-audit-28567005           0/1           8m24s      8m24s
elasticsearch-im-infra-28567005           1/1           13s        8m24s
osd-delete-ownerrefs-bz1906584-27576007   1/1           5s         688d
osd-delete-ownerrefs-bz1906584-27576037   1/1           7s         688d
osd-delete-ownerrefs-bz1906584-27576067   1/1           7s         688d
Then, recheck Elastic Search Health. Sometimes, this will resolve the issue, and health will then be green.
]$ oc get elasticsearch --namespace openshift-logging
NAME            MANAGEMENT STATE   HEALTH   NODES   DATA NODES   SHARD ALLOCATION   INDEX MANAGEMENT
elasticsearch   Managed            green    3       3            al
I then next want to determine the percentage of disk space being used. In this example, 85% of the disk space is being used.
The oc exec command can be used to issue the list the Elastic Search Allocations. Notice in this example that there are 16 UNASSIGNED shards and there are 3 Elastic Search nodes, each with about 40 - 50 GB of available disk space.
- v=true includes the column headers
~]$ oc exec elasticsearch-cdm-mrpf7eom-3-566bd5f5cb-lkdz9 --container elasticsearch --namespace openshift-logging -- es_util --query="_cat/allocation?v=true"
shards disk.indices disk.used disk.avail disk.total disk.percent host         ip           node
   310      291.3gb   313.8gb     51.8gb    365.6gb           85 10.129.6.157 10.129.6.157 elasticsearch-cdm-11c6ubcb-1
   396      289.9gb   312.5gb       53gb    365.6gb           85 10.128.7.132 10.128.7.132 elasticsearch-cdm-11c6ubcb-3
   294      298.2gb     324gb     41.6gb    365.6gb           88 10.130.4.248 10.130.4.248 elasticsearch-cdm-11c6ubcb-2
    16                                                                                     UNASSIGNED
Or like this, to just return the used disk percentage.
~]$ oc exec elasticsearch-cdm-mrpf7eom-3-566bd5f5cb-lkdz9 --container elasticsearch --namespace openshift-logging -- es_util --query="_cat/allocation?h=disk.percent"
85
If the disk watermark has been reached, this often leads to shards being unable to be assigned to a node (unassigned shards), so I next check to see if there are unassigned shards using es_util --query="_cluster/health?pretty".
AVOID TROUBLE
Make sure to wrap --query in single or double quotes
oc exec elasticsearch-cdm-11c6ubcb-1-6888c6fcb9-frlxz --container elasticsearch --namespace openshift-logging -- es_util --query="_cluster/health?pretty"
Or using es_cluster_health.
oc exec elasticsearch-cdm-11c6ubcb-1-6888c6fcb9-frlxz --container elasticsearch --namespace openshift-logging -- es_cluster_health
Something like this should be returned.
{
  "cluster_name" : "elasticsearch",
  "status" : "yellow",
  "timed_out" : false,
  "number_of_nodes" : 3,
  "number_of_data_nodes" : 3,
  "active_primary_shards" : 532,
  "active_shards" : 1056,
  "relocating_shards" : 0,
  "initializing_shards" : 0,
  "unassigned_shards" : 8,
  "delayed_unassigned_shards" : 0,
  "number_of_pending_tasks" : 0,
  "number_of_in_flight_fetch" : 0,
  "task_max_waiting_in_queue_millis" : 0,
  "active_shards_percent_as_number" : 99.24812030075188
}
Or like this, using curl.
oc exec elasticsearch-cdm-11c6ubcb-1-6888c6fcb9-frlxz --container elasticsearch --namespace openshift-logging -- curl -tls1.2 --silent --insecure --cert /etc/elasticsearch/secret/admin-cert --key /etc/elasticsearch/secret/admin-key --request GET --url https://localhost:9200/_cluster/health?pretty
You can list the shards that are unassigned.
- prirep "r" means replica shard
- prirep "p" means primary shard
- s=state means the output will be sorted on the "state" column.
- v=true includes the column headers
AVOID TROUBLE
Make sure to wrap --query in single or double quotes
~]$ oc exec elasticsearch-cdm-11c6ubcb-1-6888c6fcb9-frlxz --container elasticsearch --namespace openshift-logging -- es_util --query="_cat/shards?v=true&h=index,shard,prirep,state,node,unassigned.reason&s=state" | grep -i unassign
index                            shard prirep state      node                         unassigned.reason
app-019996                       2     r      UNASSIGNED                              INDEX_CREATED
app-019996                       1     r      UNASSIGNED                              INDEX_CREATED
app-019996                       0     r      UNASSIGNED                              INDEX_CREATED
infra-019990                     2     r      UNASSIGNED                              INDEX_CREATED
infra-019990                     1     r      UNASSIGNED                              INDEX_CREATED
infra-019990                     0     r      UNASSIGNED                              INDEX_CREATED
infra-019989                     2     r      UNASSIGNED                              INDEX_CREATED
infra-019989                     0     r      UNASSIGNED                              INDEX_CREATED
If you do not want to include the column heading, do not include v=true.
~]$ oc exec elasticsearch-cdm-11c6ubcb-1-6888c6fcb9-frlxz --container elasticsearch --namespace openshift-logging -- es_util --query="_cat/shards?h=index,shard,prirep,state,node,unassigned.reason&s=state" | grep -i unassign
app-019996                       2     r      UNASSIGNED                              INDEX_CREATED
app-019996                       1     r      UNASSIGNED                              INDEX_CREATED
app-019996                       0     r      UNASSIGNED                              INDEX_CREATED
infra-019990                     2     r      UNASSIGNED                              INDEX_CREATED
infra-019990                     1     r      UNASSIGNED                              INDEX_CREATED
infra-019990                     0     r      UNASSIGNED                              INDEX_CREATED
infra-019989                     2     r      UNASSIGNED                              INDEX_CREATED
infra-019989                     0     r      UNASSIGNED                              INDEX_CREATED
Or like this, using curl.
oc exec elasticsearch-cdm-11c6ubcb-1-6888c6fcb9-frlxz --container elasticsearch --namespace openshift-logging -- curl -tls1.2 --silent --insecure --cert /etc/elasticsearch/secret/admin-cert --key /etc/elasticsearch/secret/admin-key --request GET --url https://localhost:9200/_cat/shards?h=index,shard,prirep,state,node,unassigned.reason&s=state
Often, when health is yellow or red, there will also be yellow or red indices.
The oc exec command can be used to issue the es_util command in the Elastic Search pods to determine the status of the incides (green, yellow or red).
- v=true includes the column headers
- s=index sorts the output on the index column
AVOID TROUBLE
Make sure to wrap --query in single or double quotes
oc exec elasticsearch-cdm-mrpf7eom-3-566bd5f5cb-lkdz9 --container elasticsearch --namespace openshift-logging -- es_util --query="_cat/indices?v=true&s=index"
Or like this, using curl.
oc exec elasticsearch-cdm-mrpf7eom-3-566bd5f5cb-lkdz9 --container elasticsearch --namespace openshift-logging -- curl -tls1.2 --silent --insecure --cert /etc/elasticsearch/secret/admin-cert --key /etc/elasticsearch/secret/admin-key --request GET --url https://localhost:9200/_cat/indices
Something like this should be returned. Notice in this example that most of the indices are green but one is yellow.
green  open infra-000302                     x8PjTR4wR5uVRP9fRcVy2w 3 1 42496966 0 53.3gb 26.7gb
green  open app-000314                       01WN418uS9qfPT0UQoYw8g 3 1  7594357 0 14.1gb    7gb
green  open .kibana_-904912665_janedoe       XcVx1lWGRzadZ0ZOzUxc_w 1 1        2 0 41.7kb 20.8kb
green  open .kibana_-910309821_johndoe       dv4LG1xXRBi4kdQk1KNM1w 1 1        1 0  7.4kb  3.7kb
green  open audit-000060                     5_y1T60uQRCC1TW6WyzTwA 3 1        0 0  1.5kb   783b
yellow open infra-019989                     9hN0y56BRjCtE5FTHqM9mw 3 1  2582087 0  8.5gb  6.3gb
Deleting indices should reduce the amount of disk space being used.
The es_util command with the -X DELETE or --request DELETE option can be used to delete an indice.
oc exec elasticsearch-cdm-mrpf7eom-3-566bd5f5cb-lkdz9 --container elasticsearch -- es_util --query=infra-000302 --request DELETE
Or like this, using curl.
oc exec elasticsearch-cdm-11c6ubcb-1-6888c6fcb9-frlxz --container elasticsearch --namespace openshift-logging -- curl -tls1.2 --silent --insecure --cert /etc/elasticsearch/secret/admin-cert --key /etc/elasticsearch/secret/admin-key --url https://localhost:9200/infra-007914 --request DELETE
Did you find this article helpful?
If so, consider buying me a coffee over at 