
Let's say you get an alert ElasticsearchDiskSpaceRunningLow. This means OpenShift anticipates that disk space is expected to run out within the next 6 hours. Or ElasticsearchNodeDiskWatermarkReached meaning the low watermark limit has been reached.
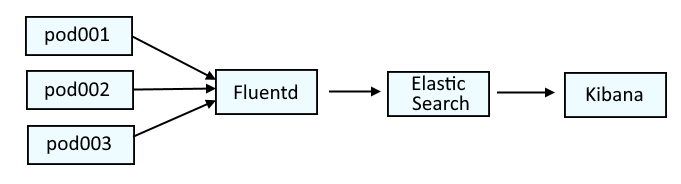
This has something to do with Elastic Search in the openshift-logging project. This diagram illustrates the systems that are typically used to parse log data on OpenShift. Fluentd collects the log data from the containers and passes the log data onto Elastic Search. Optionally, Kibana can be used as a tool that may make it easier to visualize the logs.
This is similar to the ELK stack (Elastic Search, Logstash, Kibana), but would actually be the EFK stack (Elastic Search, Fluentd, Kibana).
If you are not familiar with the oc command, refer to OpenShift - Getting Started with the oc command.
The oc get pods command can be used to list the Elastic Search pods in the openshift-logging project.
~]$ oc get pods --namespace openshift-logging
NAME                                            READY   STATUS      RESTARTS   AGE
elasticsearch-cdm-11c6ubcb-1-6888c6fcb9-frlxz   2/2     Running     0          5d5h
elasticsearch-cdm-11c6ubcb-2-6bddf77998-9m28k   2/2     Running     0          5d4h
elasticsearch-cdm-11c6ubcb-3-5955f88f5-mm9c2    2/2     Running     0          5d4h
elasticsearch-im-app-28342275-dkg7m             0/1     Completed   0          4m38s
elasticsearch-im-audit-28342275-nldkt           0/1     Completed   0          4m38s
elasticsearch-im-infra-28342275-b624d           0/1     Completed   0          4m38s
The oc exec command can be used to list the available and used disk space with the Elastic Search Shard Allocations. Notice in this example that there are 16 UNASSIGNED shards and there are 3 Elastic Search nodes, each with about 40 - 50 GB of available disk space.
~]$ oc exec elasticsearch-cdm-mrpf7eom-3-566bd5f5cb-lkdz9 --container elasticsearch --namespace openshift-logging -- es_util --query="_cat/allocation?v&pretty"
shards disk.indices disk.used disk.avail disk.total disk.percent host         ip           node
   310      291.3gb   313.8gb     51.8gb    365.6gb           85 10.129.6.157 10.129.6.157 elasticsearch-cdm-11c6ubcb-1
   396      289.9gb   312.5gb       53gb    365.6gb           85 10.128.7.132 10.128.7.132 elasticsearch-cdm-11c6ubcb-3
   294      298.2gb     324gb     41.6gb    365.6gb           88 10.130.4.248 10.130.4.248 elasticsearch-cdm-11c6ubcb-2
    16                                                                                     UNASSIGNED
The oc exec command can be used to issue the Elastic Search health status command in the Elastic Search pods to get the current health status.
oc exec elasticsearch-cdm-mrpf7eom-3-566bd5f5cb-lkdz9 --container elasticsearch --namespace openshift-logging -- health
Which should return something like this.
- green = there are zero unassigned shards
- yellow = there are one or more unassigned replica shards
- red = there are one or more unassigned primary shards
epoch      timestamp cluster       status node.total node.data shards pri relo init unassign pending_tasks max_task_wait_time active_shards_percent
1700541655 04:40:55  elasticsearch yellow          3         3   1056 529    0    0        2             0                  -                 99.8%
Or like this.
~]$ oc exec elasticsearch-cdm-11c6ubcb-1-6888c6fcb9-frlxz --container elasticsearch --namespace openshift-logging -- es_util --query="_cluster/health?pretty"
{
  "cluster_name" : "elasticsearch",
  "status" : "yellow",
  "timed_out" : false,
  "number_of_nodes" : 3,
  "number_of_data_nodes" : 3,
  "active_primary_shards" : 532,
  "active_shards" : 1056,
  "relocating_shards" : 0,
  "initializing_shards" : 0,
  "unassigned_shards" : 8,
  "delayed_unassigned_shards" : 0,
  "number_of_pending_tasks" : 0,
  "number_of_in_flight_fetch" : 0,
  "task_max_waiting_in_queue_millis" : 0,
  "active_shards_percent_as_number" : 99.24812030075188
}
Likewise, HEALTH of elasticsearch should be the same.
 ~]$ oc get elasticsearch --namespace openshift-logging
NAME            MANAGEMENT STATE   HEALTH   NODES   DATA NODES   SHARD ALLOCATION   INDEX MANAGEMENT
elasticsearch   Managed            yellow   3       3
And in one of the Elastic Search pods, you should be able to see the size, used, available and use% of the /elasticsearch/persistent volume.
~]$ oc exec elasticsearch-cdm-11c6ubcb-1-6888c6fcb9-frlxz --container elasticsearch --namespace openshift-logging -- df -h
Filesystem                            Size  Used Avail Use% Mounted on
overlay                               160G   90G   70G  57% /
tmpfs                                  64M     0   64M   0% /dev
tmpfs                                  26G     0   26G   0% /sys/fs/cgroup
shm                                    64M     0   64M   0% /dev/shm
tmpfs                                  26G   53M   26G   1% /etc/passwd
/dev/sdb                              366G  215G  152G  59% /elasticsearch/persistent
/dev/mapper/coreos-luks-root-nocrypt  160G   90G   70G  57% /etc/hosts
tmpfs                                  17G   28K   17G   1% /etc/openshift/elasticsearch/secret
tmpfs                                  17G   32K   17G   1% /run/secrets/kubernetes.io/serviceaccount
tmpfs                                  26G     0   26G   0% /proc/acpi
tmpfs                                  26G     0   26G   0% /proc/scsi
tmpfs                                  26G     0   26G   0% /sys/firmware
Next you'll want to determine why there are unassigned shards.
~]$ oc exec elasticsearch-cdm-11c6ubcb-1-6888c6fcb9-frlxz --container elasticsearch --namespace openshift-logging -- es_util --query="_cluster/allocation/explain?pretty"
{
  "index" : "app-019996",
  "shard" : 1,
  "primary" : false,
  "current_state" : "unassigned",
  "unassigned_info" : {
    "reason" : "INDEX_CREATED",
    "at" : "2023-11-21T04:45:05.399Z",
    "last_allocation_status" : "no_attempt"
  },
  "can_allocate" : "no",
  "allocate_explanation" : "cannot allocate because allocation is not permitted to any of the nodes",
  "node_allocation_decisions" : [
    {
      "node_id" : "Yg84vLgMTQy5uZlxuXJDuQ",
      "node_name" : "elasticsearch-cdm-11c6ubcb-1",
      "transport_address" : "10.129.6.157:9300",
      "node_decision" : "no",
      "weight_ranking" : 1,
      "deciders" : [
        {
          "decider" : "disk_threshold",
          "decision" : "NO",
          "explanation" : "the node is above the low watermark cluster setting [cluster.routing.allocation.disk.watermark.low=85%], using more disk space than the maximum allowed [85.0%], actual free: [10.542218124998866%]"
        }
      ]
    },
    {
      "node_id" : "JyErv2KCQUO3hRrmqY7EeA",
      "node_name" : "elasticsearch-cdm-11c6ubcb-2",
      "transport_address" : "10.130.4.248:9300",
      "node_decision" : "no",
      "weight_ranking" : 2,
      "deciders" : [
        {
          "decider" : "same_shard",
          "decision" : "NO",
          "explanation" : "the shard cannot be allocated to the same node on which a copy of the shard already exists [[app-019996][1], node[JyErv2KCQUO3hRrmqY7EeA], [P], s[STARTED], a[id=_f2Y4pc4SJ2wfuqaEDosWA]]"
        },
        {
          "decider" : "disk_threshold",
          "decision" : "NO",
          "explanation" : "the node is above the low watermark cluster setting [cluster.routing.allocation.disk.watermark.low=85%], using more disk space than the maximum allowed [85.0%], actual free: [10.760874016856427%]"
        }
      ]
    },
    {
      "node_id" : "A2oUJ9LNRsO1C-NV1xOVdg",
      "node_name" : "elasticsearch-cdm-11c6ubcb-3",
      "transport_address" : "10.128.7.132:9300",
      "node_decision" : "no",
      "weight_ranking" : 3,
      "deciders" : [
        {
          "decider" : "disk_threshold",
          "decision" : "NO",
          "explanation" : "the node is above the low watermark cluster setting [cluster.routing.allocation.disk.watermark.low=85%], using more disk space than the maximum allowed [85.0%], actual free: [9.577802163517253%]"
        }
      ]
    }
  ]
}
You can list the shards that are unassigned.
- prirep "r" means replica shard
- prirep "p" means primary shard
~]$ oc exec elasticsearch-cdm-11c6ubcb-1-6888c6fcb9-frlxz --container elasticsearch --namespace openshift-logging -- es_util --query="_cat/shards?v=true&h=index,shard,prirep,state,node,unassigned.reason&s=state" | grep -i unassign
index                            shard prirep state      node                         unassigned.reason
app-019996                       2     r      UNASSIGNED                              INDEX_CREATED
app-019996                       1     r      UNASSIGNED                              INDEX_CREATED
app-019996                       0     r      UNASSIGNED                              INDEX_CREATED
infra-019990                     2     r      UNASSIGNED                              INDEX_CREATED
infra-019990                     1     r      UNASSIGNED                              INDEX_CREATED
infra-019990                     0     r      UNASSIGNED                              INDEX_CREATED
infra-019989                     2     r      UNASSIGNED                              INDEX_CREATED
infra-019989                     0     r      UNASSIGNED                              INDEX_CREATED
Then list the indicies.
oc exec elasticsearch-cdm-mrpf7eom-3-566bd5f5cb-lkdz9 --container elasticsearch --namespace openshift-logging -- es_util --query=_cat/indices
Something like this should be returned. Notice in this example that most of the indices are green but one is yellow.
green  open .kibana_-906638801_c056827       m21mB4LfTCCl-qjhCSaJeg 1 1        1 0  7.4kb  3.7kb
green  open infra-000302                     x8PjTR4wR5uVRP9fRcVy2w 3 1 42496966 0 53.3gb 26.7gb
green  open .kibana_-905774834_c064834_64836 eGHPVYcjQ0SvHE8rC07uSw 1 1        2 0 41.8kb 20.9kb
green  open app-000314                       01WN418uS9qfPT0UQoYw8g 3 1  7594357 0 14.1gb    7gb
green  open .kibana_-904912665_c072681       XcVx1lWGRzadZ0ZOzUxc_w 1 1        2 0 41.7kb 20.8kb
green  open .kibana_-911203611_c008109_8111  PE-6_Sg5QNSALuCfO30bjw 1 1        1 0  7.4kb  3.7kb
green  open .kibana_-908460704_c037375_37377 vacmuzJ7QdWEXjQWzMWhUg 1 1        1 0  7.4kb  3.7kb
green  open .kibana_267696147_n072990_72992  QRGJv7LIRUCPTptYl8ug0w 1 1        1 0  7.4kb  3.7kb
green  open .kibana_-910309821_c017127       dv4LG1xXRBi4kdQk1KNM1w 1 1        1 0  7.4kb  3.7kb
green  open audit-000060                     5_y1T60uQRCC1TW6WyzTwA 3 1        0 0  1.5kb   783b
yellow open infra-019989                     9hN0y56BRjCtE5FTHqM9mw 3 1  2582087 0  8.5gb  6.3gb
You may want to delete the oldest indices to free up some disk space.
oc exec elasticsearch-cdm-mrpf7eom-3-566bd5f5cb-lkdz9 --container elasticsearch -- es_util --query=infra-000302 --request DELETE
Immediately after you delete the oldest indices, you should see an increase in the disk.avail space with the Elastic Search Shard Allocations and over the next few minutes, the UNASSIGNED shards count should decrease as shards get assigned.
~]$ oc exec elasticsearch-cdm-mrpf7eom-3-566bd5f5cb-lkdz9 --container elasticsearch --namespace openshift-logging -- es_util --query="_cat/allocation?v&pretty"
shards disk.indices disk.used disk.avail disk.total disk.percent host         ip           node
   391      225.8gb   247.7gb    117.9gb    365.6gb           67 10.128.7.132 10.128.7.132 elasticsearch-cdm-11c6ubcb-3
   291      246.9gb   273.8gb     91.8gb    365.6gb           74 10.130.4.248 10.130.4.248 elasticsearch-cdm-11c6ubcb-2
   310      242.8gb   265.7gb     99.8gb    365.6gb           72 10.129.6.157 10.129.6.157 elasticsearch-cdm-11c6ubcb-1
    16                                                                                     UNASSIGNED
After you delete the oldest indices, the health output will probably have initializing_shards. Just wait a few minutes, reissue the command, and see if initializing_shards and unassigned_shards has reached 0. If there are still one or more unassigned_shards, you may just need to delete a few more of the oldest indices.
~]$ oc exec elasticsearch-cdm-11c6ubcb-1-6888c6fcb9-frlxz --container elasticsearch --namespace openshift-logging -- es_util --query=_cluster/health?pretty; done;
{
  "cluster_name" : "elasticsearch",
  "status" : "yellow",
  "timed_out" : false,
  "number_of_nodes" : 3,
  "number_of_data_nodes" : 3,
  "active_primary_shards" : 532,
  "active_shards" : 1056,
  "relocating_shards" : 0,
  "initializing_shards" : 0,
  "unassigned_shards" : 8,
  "delayed_unassigned_shards" : 0,
  "number_of_pending_tasks" : 0,
  "number_of_in_flight_fetch" : 0,
  "task_max_waiting_in_queue_millis" : 0,
  "active_shards_percent_as_number" : 99.24812030075188
}
Then display the cluster settings and ensure that persistent.cluster.routing.allocation.enabled is all.
~]$ oc exec elasticsearch-cdm-11c6ubcb-1-6888c6fcb9-frlxz --container elasticsearch --namespace openshift-logging -- es_util --query="_cat/_cluster/settings?pretty"
{
  "persistent" : {
    "cluster" : {
      "routing" : {
        "allocation" : {
          "enable" : "all"
        }
      }
    },
    "discovery" : {
      "zen" : {
        "minimum_master_nodes" : "2"
      }
    }
  },
  "transient" : { }
}
You may need to increase the amount of storage being allocated for the Elastic Search Persistent Volume Claims. In this example, 500 GB is being reserved for the Elastic Search Persistent Volume Claims.
~]$ oc get clusterlogging instance --namespace openshift-logging --output yaml | grep size:
        size: 500G
And you can also see the CAPACITY for each Elastic Search Persistent Volume Claim.
~]$ oc get persistentvolumeclaims --namespace openshift-logging
NAME                                         STATUS   VOLUME                                     CAPACITY   ACCESS MODES   STORAGECLASS   AGE
elasticsearch-elasticsearch-cdm-11c6ubcb-1   Bound    pvc-a4162a73-1d8d-4525-bcd0-361a1b4e1e01   476838Mi   RWO            thin           72m
elasticsearch-elasticsearch-cdm-11c6ubcb-2   Bound    pvc-e1f6c35f-ab5a-4198-8aa9-97552e8e906e   476838Mi   RWO            thin           72m
elasticsearch-elasticsearch-cdm-11c6ubcb-3   Bound    pvc-bc24e0e3-024e-411a-8210-0b5645590b53   476838Mi   RWO            thin           72m
If you need to increase the amount of memory being reserved for the Elastic Search Persistent Volume Claims, first you will want to set clusterlogging instance and elasticsearch to Unmanaged.
oc patch clusterlogging instance --namespace openshift-logging --type merge --patch '{"spec":{"managementState":"Unmanaged"}}'

oc patch elasticsearch elasticsearch --namespace openshift-logging --type merge --patch '{"spec":{"managementState":"Unmanaged"}}'
And validate that both clusterlogging instance and elasticsearch are Unmanaged.
~]$ oc get clusterlogging instance --namespace openshift-logging
NAME       MANAGEMENT STATE
instance   Unmanaged

~]$ oc get elasticsearch --namespace openshift-logging
NAME            MANAGEMENT STATE   HEALTH   NODES   DATA NODES   SHARD ALLOCATION   INDEX MANAGEMENT
elasticsearch   Unmanaged          green    3       3            all
Then scale down the Elastic Search CDM deployments down to zero replicas.
oc scale deployment elasticsearch-cdm-11c6ubcb-1 --namespace openshift-logging --replicas 0
The delete the Elastic Search Persistent Volume Claims.
oc delete persistentvolumeclaim elasticsearch-elasticsearch-cdm-11c6ubcb-1 --namespace openshift-logging
Then patch clusterlogging instance, increasing the logStore elasticsearch storage size.
oc patch clusterlogging instance --namespace openshift-logging --type merge --patch '{"spec":{"logStore":{"elasticsearch":{"storage":{"size":"1000G"}}}}}'
Then set clusterlogging instance and elasticsearch to Managed.
oc patch clusterlogging instance --namespace openshift-logging --type merge --patch '{"spec":{"managementState":"Managed"}}'

oc patch elasticsearch elasticsearch --namespace openshift-logging --type merge --patch '{"spec":{"managementState":"Managed"}}'
And validate that both clusterlogging instance and elasticsearch are Managed.
~]$ oc get clusterlogging instance --namespace openshift-logging
NAME       MANAGEMENT STATE
instance   Managed

~]$ oc get elasticsearch --namespace openshift-logging
NAME            MANAGEMENT STATE   HEALTH   NODES   DATA NODES   SHARD ALLOCATION   INDEX MANAGEMENT
elasticsearch   Managed            green    3       3            all
Then scale up the Elastic Search CDM deployments down to one replica.
oc scale deployment elasticsearch-cdm-11c6ubcb-1 --namespace openshift-logging --replicas 1
New Elastic Search Persistent Volume Claims should be created, where the Persistent Volume Claims have more CAPACITY.
~]$ oc get persistentvolumeclaims --namespace openshift-logging
NAME                                         STATUS   VOLUME                                     CAPACITY    ACCESS MODES   STORAGECLASS   AGE
elasticsearch-elasticsearch-cdm-11c6ubcb-1   Bound    pvc-a4162a73-1d8d-4525-bcd0-361a1b4e1e01   1576838Mi   RWO            thin           72m
elasticsearch-elasticsearch-cdm-11c6ubcb-2   Bound    pvc-e1f6c35f-ab5a-4198-8aa9-97552e8e906e   1576838Mi   RWO            thin           72m
elasticsearch-elasticsearch-cdm-11c6ubcb-3   Bound    pvc-bc24e0e3-024e-411a-8210-0b5645590b53   1576838Mi   RWO            thin           72m
Did you find this article helpful?
If so, consider buying me a coffee over at 