
Understanding logging in WebSphere is no trivial matter, and in some ways, is more of an artform than a science. However, there are some techniques I've picked up through the years that have made it much easier for me to know how to approach logging in WebSphere.
Basic or HPEL?
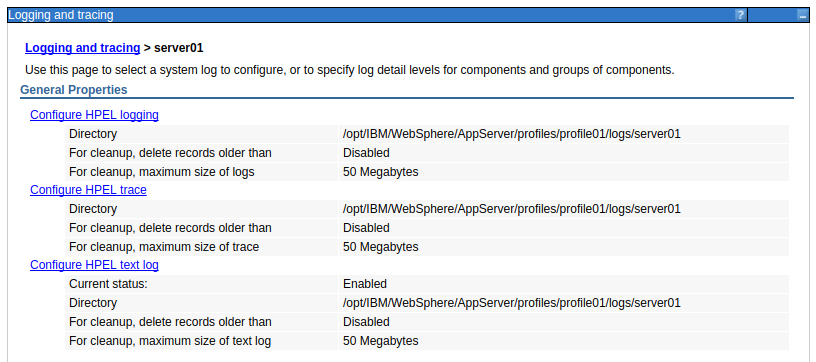
First and foremost, you must know the difference between Basic and HPEL logging. Probably the easiest way to know if you are using Basic or HPEL is to navigate to Troubleshooting > Logs and trace > your server. If you see "Configure HPEL", you are using HPEL logging.
When using Basic, the following log files will contain events. Generally speaking, SystemOut.log is the log file that is most often used. You can view the SystemOut.log and SystemErr.log files at Troubleshooting > Logs and trace > your server > JVM logs > Runtime tab > View. Or, on the command line, you can view the log files at ${WAS_INSTALL_ROOT}/profiles/your_profile/logs/your_server/.
- SystemOut.log
- SystemErr.log
- trace.log
- activity.log
When using HPEL, you will use the logViewer.sh (Linux) or logViewer.bat (Windows) command to view the log files.
The main motiivation to use HPEL is that HPEL improves performance. Yay!
Application requests
Probably one of the most practical uses of the log is to see what pages users are requesting. Good news, the logs capture this.
Rotate your Basic logs!
If you are using Basic logging, let's make sure the logs are being rotated, so that way you don't choke your system with out of control log files.
Garbage Collection logs
Let's say you spot this event in the SystemErr.log or HPEL log.
java.lang.OutOfMemoryError: GC overhead limit exceeded
First and foremest, get the application server up and running again. Regardless if you are using Basic or HPEL, garbage collection is written to the following log files.
- native_stderr.log
- native_stdout.log
By default, garbage collection is not enabled (don't ask me why - I've no idea), so you've got to enable garbage collection. No one in their right mind manually tries to look through the garbage collection logs. That's a huge waste of time. Instead, IBMs Garbage Collection and Memory Visualizer tool is used to parse the garbage collection reports and make sense of the logs.
Digging deep - log level and tracing
When things get real ugly and the normal events written to a log file just don't have enough details to diagnose a problem, you can either change the log level to write more verbose events to the log (this is usually the best option) or try setting up a diagnostic trace, which configures the trace.log.
Following a request through multiple log files
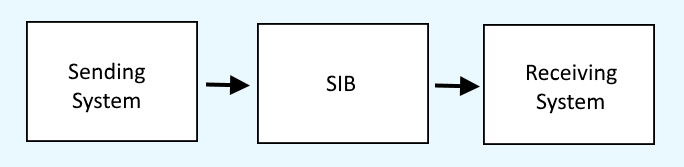
The integration of multiple different systems can make log review a real challenge. For example, a request may get recorded in a log on the sending system, then get recorded in a log on the SIB (service integration bus), and again get recorded in a log on the receiving system. It sure is going to be tough to correlate the events between these log files. Fortunately, WebSphere has a thing called Cross Component Trace (XCT). This feature adds the same Request ID to each different log file so that you can follow a request across different log files.
Did you find this article helpful?
If so, consider buying me a coffee over at 